Quantifying COVID-19's lethality in the United States
My last two newsletters have examined COVID 19’s lethality in England and Europe, respectively. This newsletter examines the disease’s lethality in the United States. As my previous newsletters noted, the two most widely discussed methods for quantifying COVID-19’s lethality – estimating the IFR and calculating the “excess deaths” – may not be very reliable. (Please read the first three paragraphs here for a summary of why.) A better method, arguably, is to compare age-standardised measures of mortality in different years or in similar populations that have been differentially exposed to the disease.
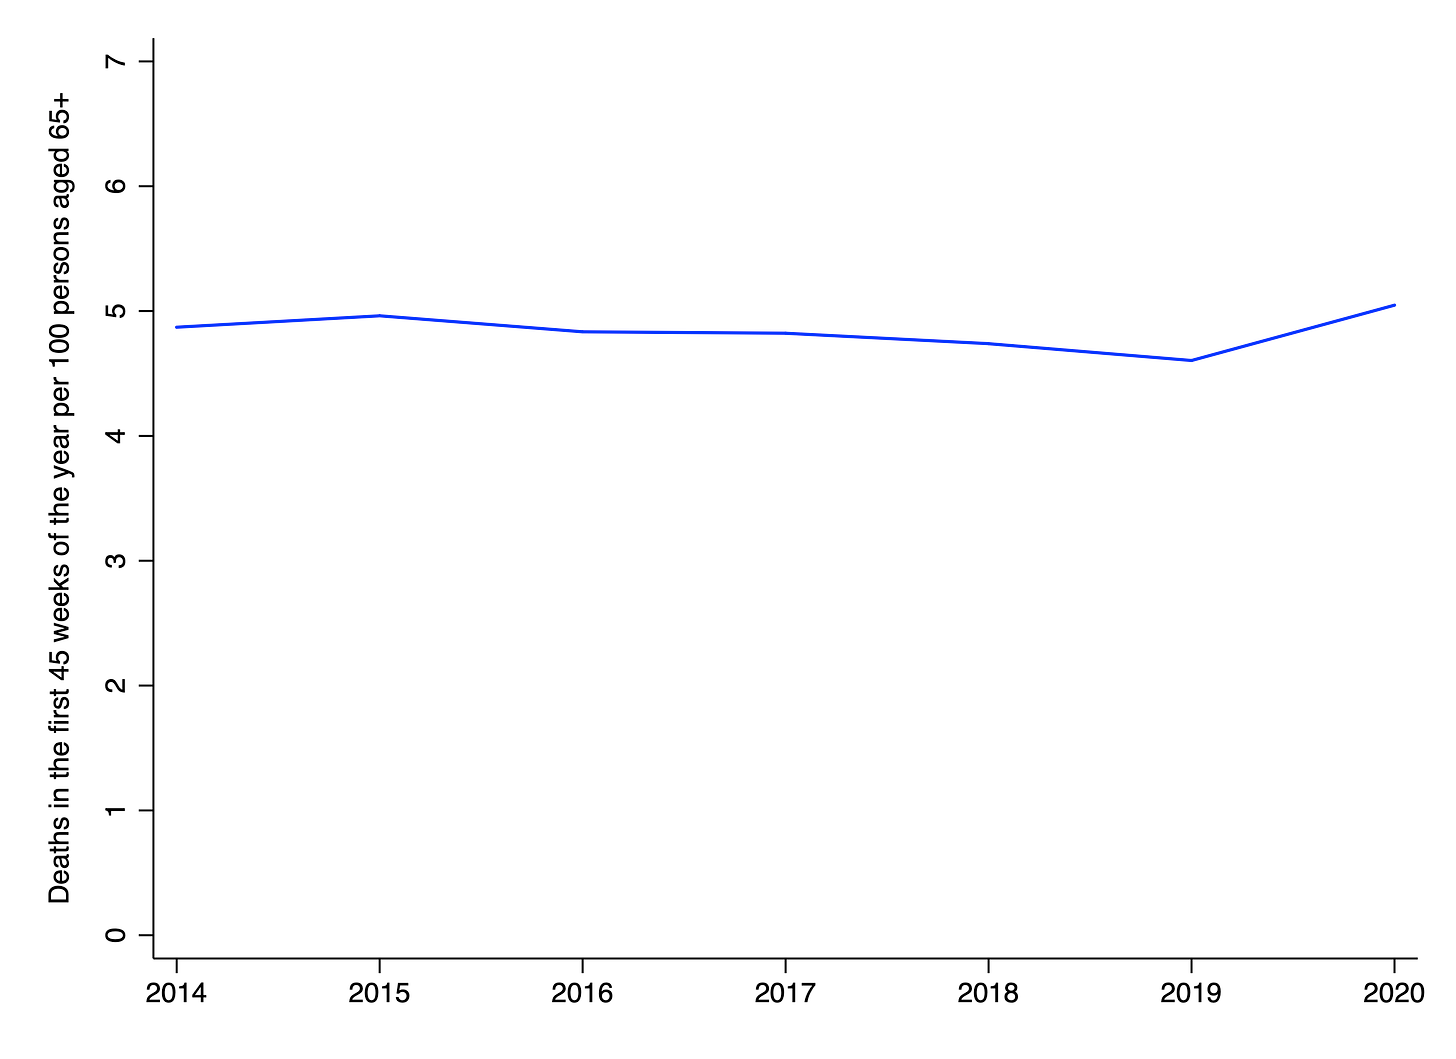
In order to calculate an age-adjusted measure of mortality for the United States, I obtained weekly data on the absolute number of deaths, and yearly data on the number of persons aged 65+ alive in January of the relevant year. Weekly data on deaths are currently available up to week 49 of 2020. However, because the counts are provisional, with data in recent weeks being the most incomplete, I decided to exclude the last 4 weeks of data. I therefore computed, for each year between 2014 and 2020, the number of deaths in the first 45 weeks of the year per 100 persons aged 65+.
As before, I used the number of persons aged 65+ as the denominator because this corresponds to the age-group in which the vast majority of deaths take place. (For example, in the US’s 2015 life table, ~85% of persons were still alive at age 64.) Adjusting for the size of the elderly population is particularly important in the United States because it has grown substantially in recent years. Just between 2014 and 2020, the number of persons aged 65+ increased by 9.6 million or 21%. Figures are shown in the chart below.
Unsurprisingly, there is a noticeable uptick in mortality associated with the COVID-19 pandemic. However, the increase in mortality looks somewhat less pronounced than on charts showing excess deaths. In fact, the number of deaths in the first 45 weeks of the year per 100 persons aged 65+ was only 1.7% higher in 2020 than in 2015. Although there were ~450,000 more deaths in the first 45 weeks of 2020 than in the first 45 weeks of 2015, there were ~8.1 million more persons aged 65+ alive at the beginning of 2020 than at the beginning of 2015.
Three important caveats should be attached to the chart above. First, the death counts on which the chart is based are provisional, and may subject to non-trivial upward revision in the coming weeks. Second, the measure plotted should only be considered a rough measure of age-adjusted mortality, since it does not account for differences in age-specific mortality within the broad 65+ age-group. Third, age-adjusted mortality may rise further during the last seven weeks of the year if there is additional excess mortality during that period.
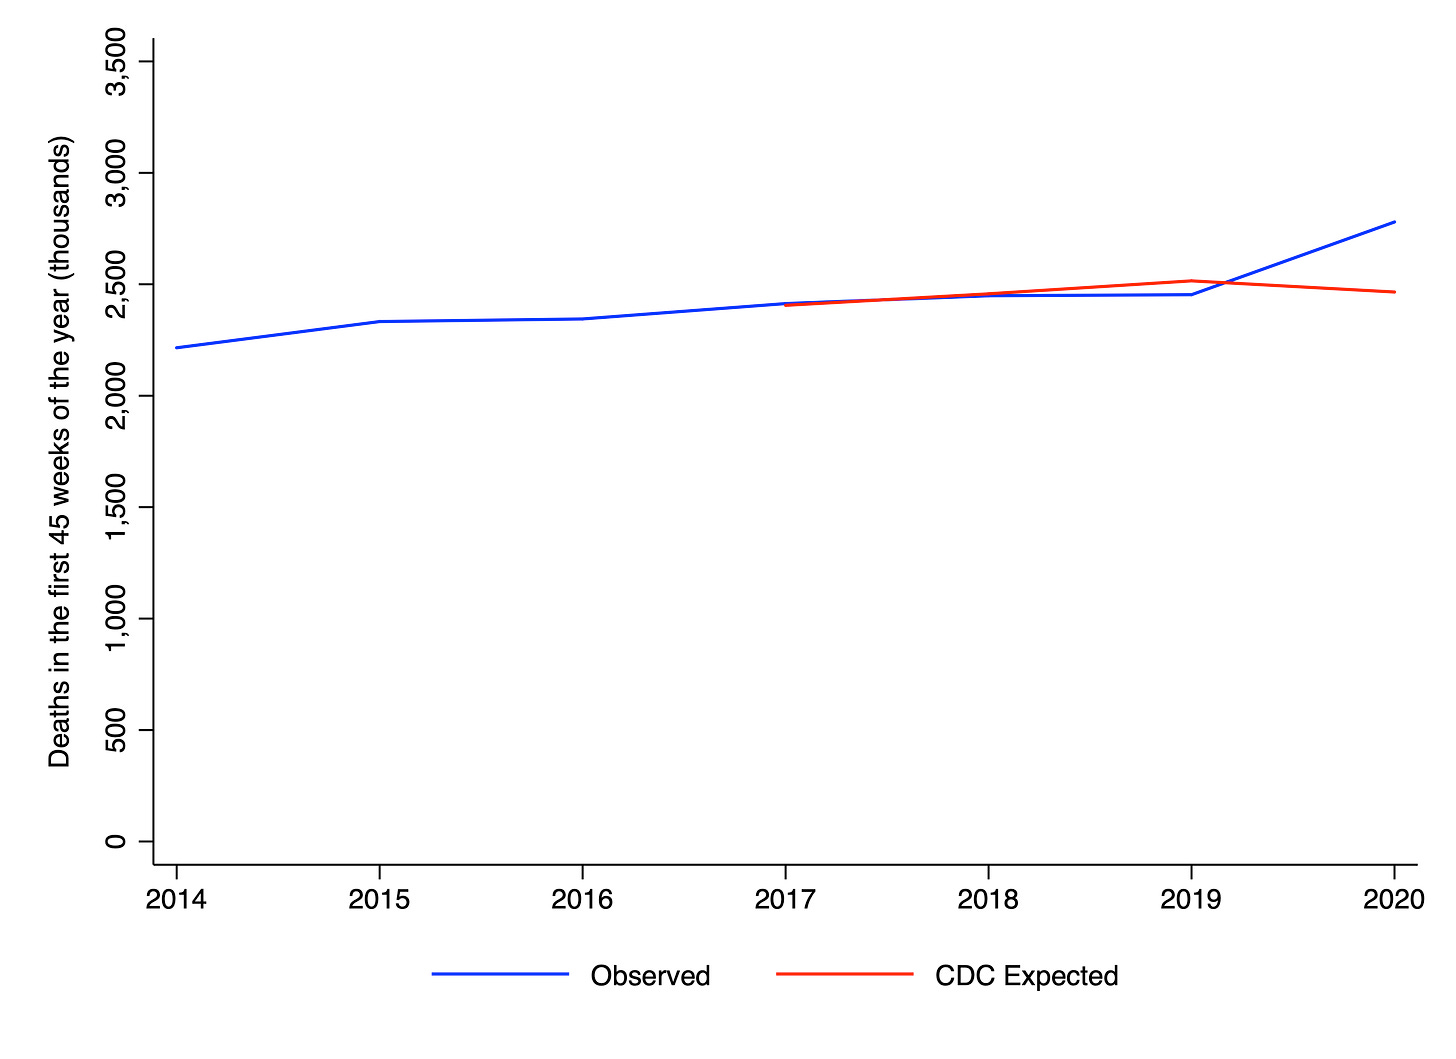
As an additional exercise, I obtained the CDC’s estimates of expected deaths in the first 45 weeks of the year, and plotted them against the observed number of deaths in the same period. (Because the estimates of expected deaths began in the second week of 2017, I added the value for that week twice when summing across the first 45 weeks of the year.) Figures are shown in the chart below.
Somewhat surprisingly, the CDC’s estimate of expected deaths for 2020 is lower than their estimate for 2019, despite the fact that there was an upward trend in the absolute number of deaths between 2014 and 2019 (as one would expect in an ageing population) and the fact that 2019 saw below-trend deaths. I am not familiar with the methods the CDC uses to estimate excess deaths, so I cannot explain this observation. But it does strike me as somewhat surprising, especially given that the number of persons aged 65+ alive at the beginning of 2020 was 3.4% higher than the number alive at the beginning of 2019.
As in the case of Europe, we will only have a comprehensive picture of COVID-19’s lethality in the United States once somebody calculates age-standardised mortality rates for this year and several preceding years.
Image: Albert Bierstadt, Cathedral Rock, 1872
Thanks for reading. If you found this newsletter useful, please share it with your friends. And please consider subscribing if you haven’t done so already.


