


Quantifying COVID-19’s lethality in England


It has been recognised since the beginning of the pandemic that attempting to estimate the IFR (the infection fatality rate) of COVID-19 by simply dividing the number of deaths by the number of infected persons may not be an accurate method. One reason is that when someone dies with COVID-19, it is not always possible to say whether he died of the disease or merely with the disease. This inferential problem is particularly severe for COVID-19 because the disease is novel and hence not yet fully-understood, and because the disease is most likely to kill persons who have one or more pre-existing conditions.
For purposes of illustration, suppose that a novel virus enters the English population, which is highly transmissible but entirely non-lethal. (It just causes flu-like symptoms for a few days, and then goes away.) If the virus were allowed to circulate, it would quickly infect, say, 70% of the population. This means it would also infect roughly 70% of those who died in the relevant year. Since 0.88% of the English population died in 2019, a naïve estimate of the IFR for this novel virus would be 0.70 x 0.88 = 0.62%. In other words, 70% of the 0.88% of people who died would die with the virus, so a naïve observer might conclude that the disease kills 0.62% of those who catch it. However, this inference would be mistaken.
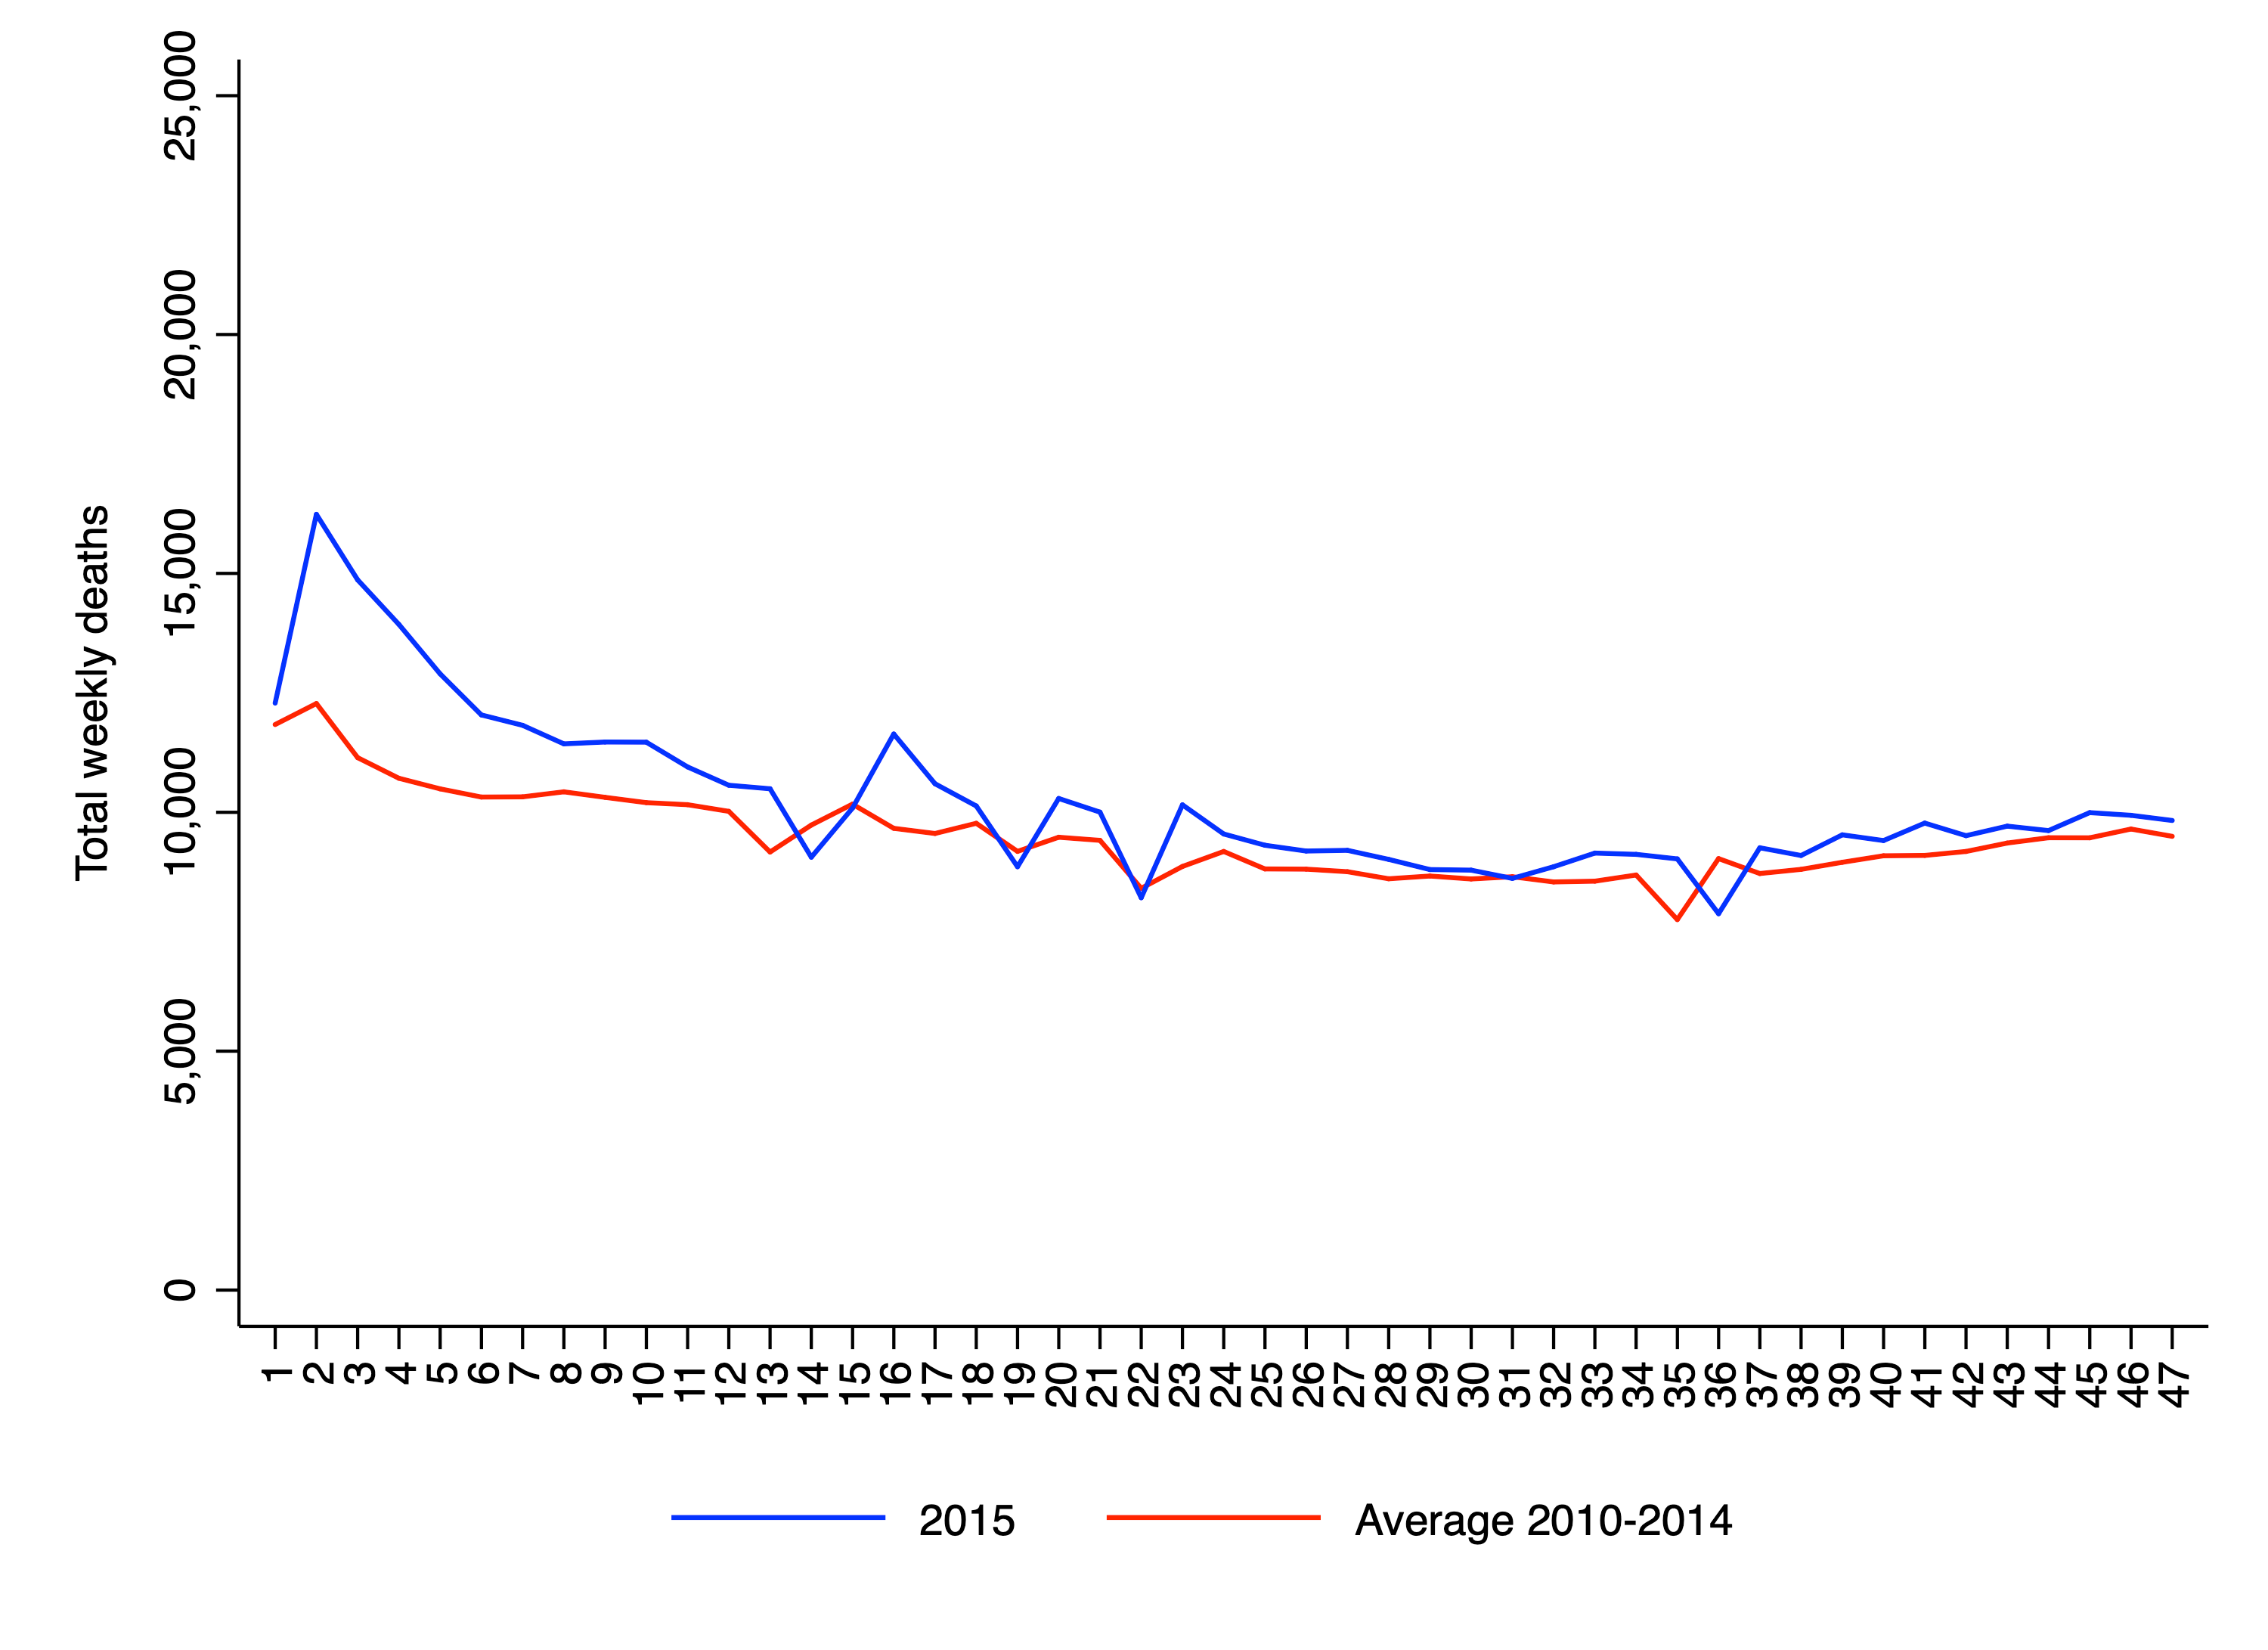
As most commentators are already aware, a better way of estimating the lethality of a novel disease like COVID-19 is to compute the “excess deaths” attributable to that disease. This involves comparing the number of observed deaths from all causes in a particular time interval to the number that would be expected based on recent historical data. A common way of computing the number of expected deaths is to take an average over the last five years. This is, for example, what the UK’s Office for National Statistics does. The chart below shows observed versus expected weekly deaths in England and Wales for the first 47 weeks of the year. The sum of the differences between the two lines provides an estimate of the excess deaths attributable to COVID-19. In this case, it is 62,638.

However, there are several problems with taking an average over the last five years to compute expected deaths in a country like England and Wales. First, the total population is increasing over time. Second, the population is ageing, i.e., a larger fraction of the population is entering the oldest age-categories. These two processes have the effect of increasing the absolute number of people who are at risk of dying each year. For example, just between 2015 and 2019, the number of people aged 70+ in England and Wales increased by 913,710 or 13%.
Third, the trend of mortality over time is partly self-correcting, which means that if the number of deaths was below-trend in one time period, it is more likely to be above-trend in the next time period. This is due to the so-called “dry tinder” effect. Every year, there are a certain number of frail individuals in the population who are at high risk of dying from viral infections. The intensity of the “flu season” determines how many of these individuals die, and how many survive and make it to the next year. If the flu season in one particular year (or in two successive years) happens to be rather mild, then there will be more frail individuals around in the next year. All else being equal, therefore, mortality will be higher.
In a recent unpublished paper, Chris Hope reports that England and Wales experienced relatively mild flu seasons in 2018 and 2019, at least relative to other European countries. By contrast, Greece, Slovenia and Latvia all experienced relatively bad flu seasons. Hope shows that there is a negative relationship between COVID-19 mortality and prior flu season intensity across Europe: countries that had worse flu seasons in 2018 and 2019 have seen fewer deaths from COVID-19. However, Hope’s evidence is purely correlational (as he acknowledges), so it is too early to say whether cross-country differences in COVID-19 mortality are in fact explained by prior flu season intensity.
In another unpublished paper, Jonas Herby presents evidence that Sweden experienced particularly mild flu seasons in 2018 and 2019, and argues that this may explain why the country has seen more COVID-19 deaths than Denmark and Finland. (Though it should be noted that – according to Hope’s figures – Norway is an outlier: it experienced relatively mild flu seasons in 2018 and 2019, but has so far not seen a large number of deaths from COVID-19.) Daniel Klein and his colleagues have made a similar argument to Herby in their paper about Sweden.
Due to the three factors I have mentioned – population growth, population ageing and the “dry tinder” effect – the number of expected deaths in any given year is higher than would be suggested by an average of the preceding five years, especially if the number of deaths was below-trend in the last one or two years. And indeed, some estimates of expected deaths – such as those reported by Public Health England – do take these factors into account. In a blog post published in June, Carl Heneghan and Jason Oke note that the number of excess deaths in England and Wales up to week 23 was 54,000 using a five-year average for expected deaths, but was only 31,417 using a harmonic trend. The latter figure, which is arguably more realistic, is 42% less than the former.
By way of illustration, the chart below shows observed versus expected weekly deaths in England and Wales for the first 47 weeks of 2015, which also had above-trend deaths. As in the chart for 2020, there is a consistent disparity between the two lines, which implies that 2015 saw substantial “excess deaths”. As a matter of fact, the total number of excess deaths is equal to 36,067, which is 58% as large as the figure for 2020.
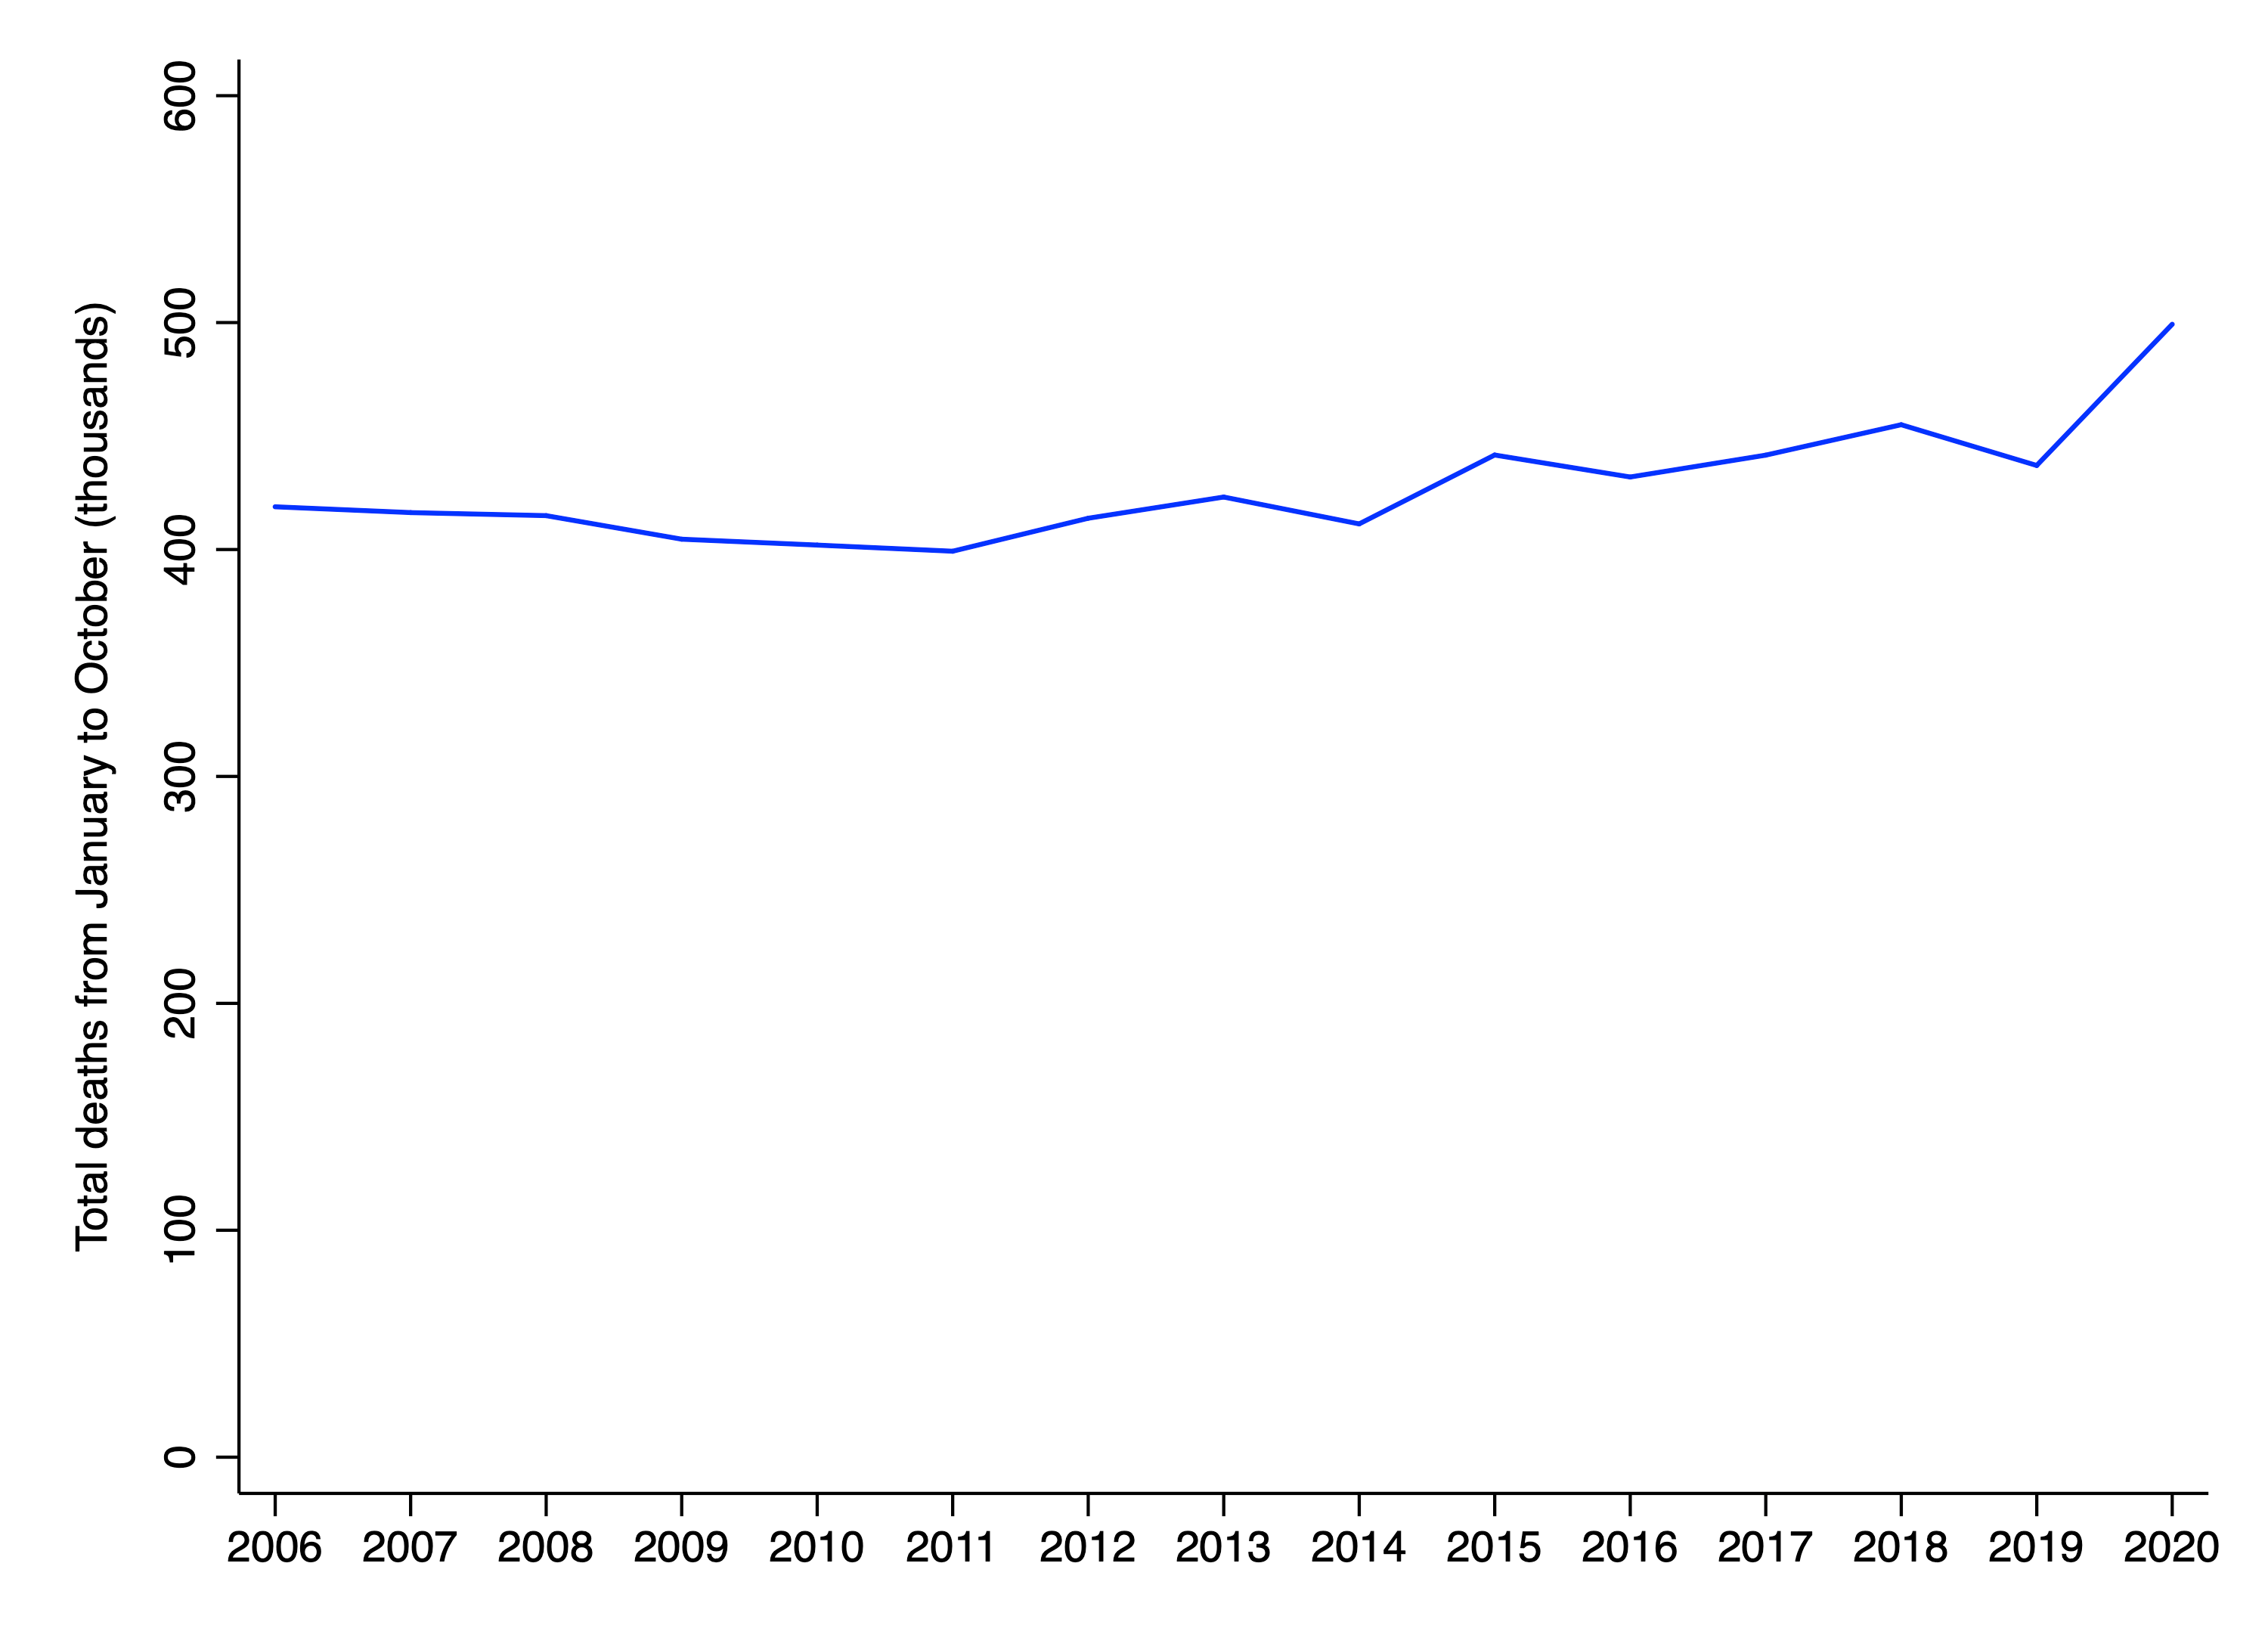
When the absolute number of deaths in England and Wales is plotted over time, the increase in mortality associated with COVID-19 looks somewhat less pronounced. As the chart below indicates, 2020 has seen more deaths than any previous year going back to 2006. However, this was also true of 2018, 2015 and 2013. Other features of interest on the chart are the upward trend in deaths beginning around 2011, which reflects population growth and ageing, as well as the below-trend deaths in 2019, which may reflect a particularly mild flu season in that year.
There is an additional – albeit minor – problem with estimating the lethality of COVID-19 by computing excess deaths, namely that people dying of COVID-19 (or at least, those inferred to be dying of it) are slightly older than people dying of all other causes. According to a report from 10 October, the average age of death for COVID-19 in England and Wales is 82.4, whereas the average age of death for other causes is 81.5. This means that deaths attributable to COVID-19 involve the loss of slightly fewer life-years than deaths attributable to other causes. Since what we really care about is total life-years lost, excess deaths will slightly overstate COVID-19’s impact on mortality.
The best way of estimating the lethality of COVID-19 is to compare age-standardised measures of mortality in different years (or in similar populations that have been differentially exposed to COVID-19). These measures – the most of common of which are the age-standardised mortality rate and the life expectancy – take into account both the risk of dying at different ages and the age-structure of the population. Suppose there are two countries in which the risk of dying at each age is the same. One has an average age of 30 and the other has an average age of 50. Even though the risk of dying is the same, there will be many more deaths in the country with an average age of 50.
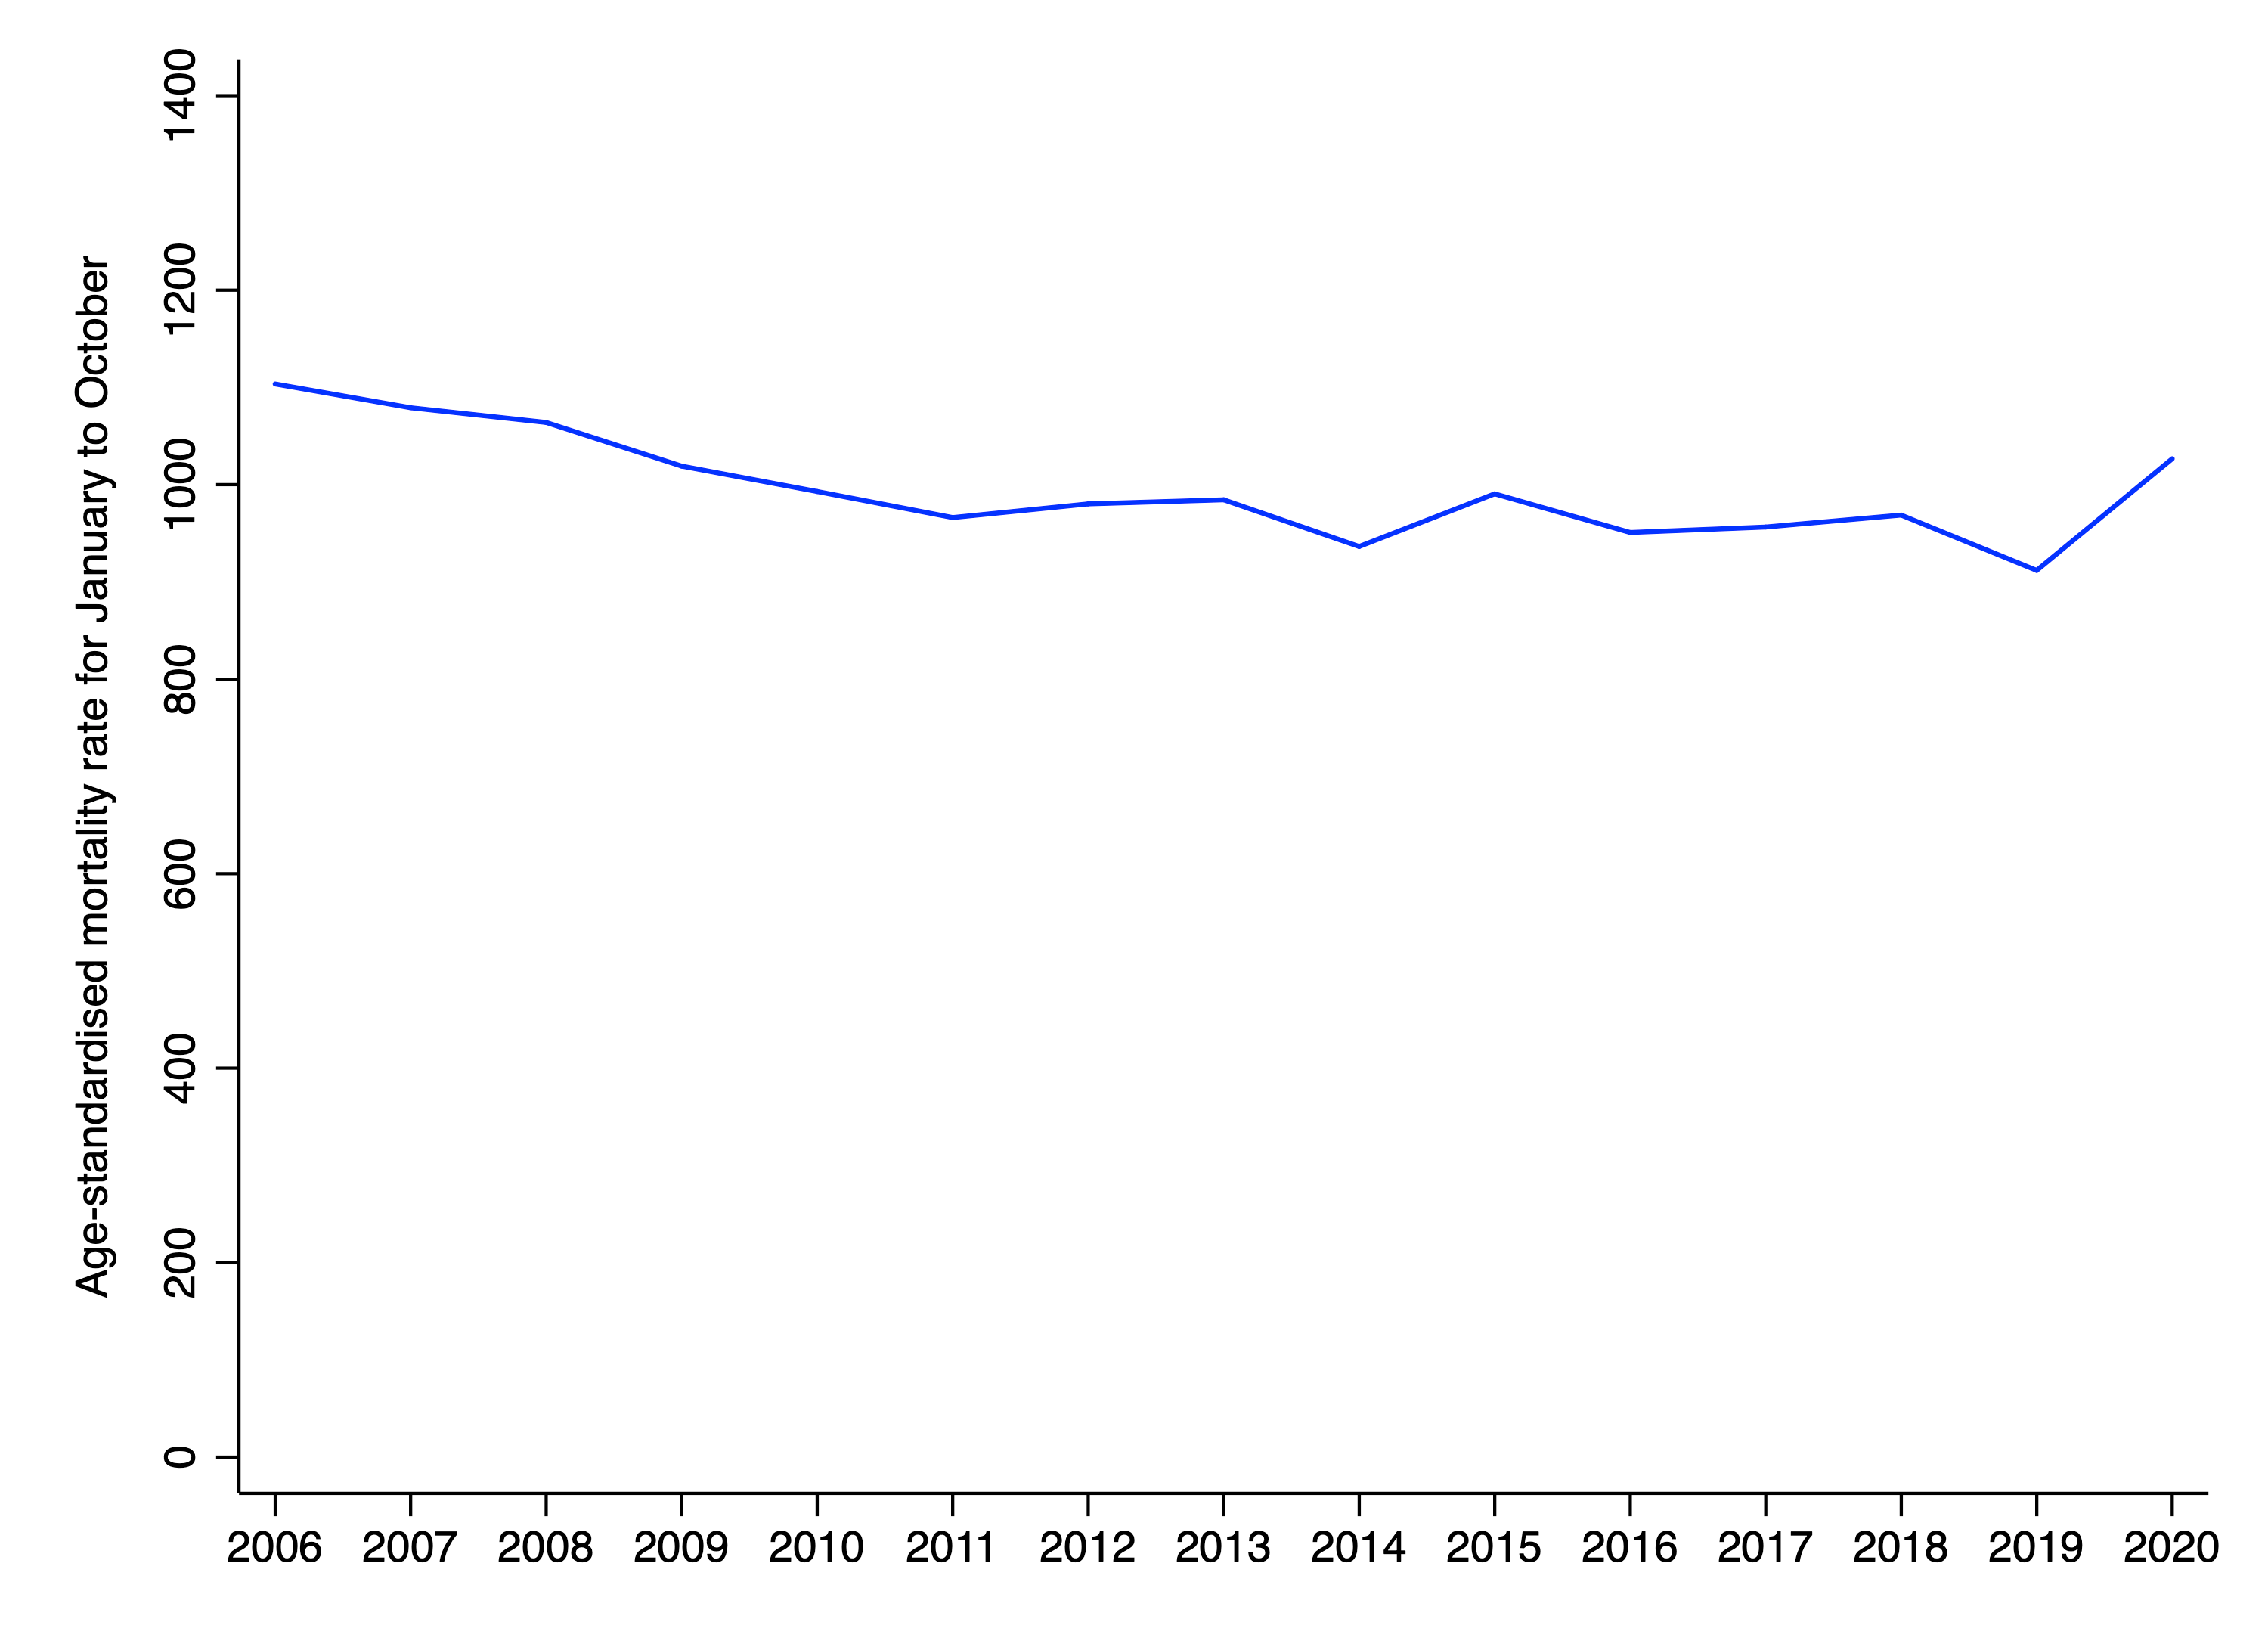
In order to calculate the age-standardised mortality rate or the life expectancy, you need to know not only the number of deaths, but also the ages of the people dying, as well as the age-structure of the population as a whole. Hence it is not possible to compute these measures using only information about weekly reported deaths. However, the UK’s Office for National Statistics reports the age-standardised mortality rate for the first ten months of the year, each year, going back to 2001. Their chart is reproduced below for the period 2006 to 2020. It indicates that the risk of mortality in 2020 has been higher than every year since 2008 in England. (Wales is not shown.) Consistent with the chart above, it also indicates that the risk of mortality was below-trend in 2019.
Life expectancy, a closely related measure, is more intuitive than the age-standardised mortality rate. It is defined as the number of years an individual born in a given year would be expected to live if she were subject to the current age-specific mortality rates for the remainder of her life. As the chart below indicates, life expectancy and the age-standardised mortality rate are almost perfectly correlated across years (r = –.99), which allows us to estimate the life expectancy for the first ten months of 2020. It comes out at 80.5, down from 81.8 in 2019. (This means that if current age-specific mortality rates continued into the future, someone born in 2020 could be expected to live 80.5 years.)
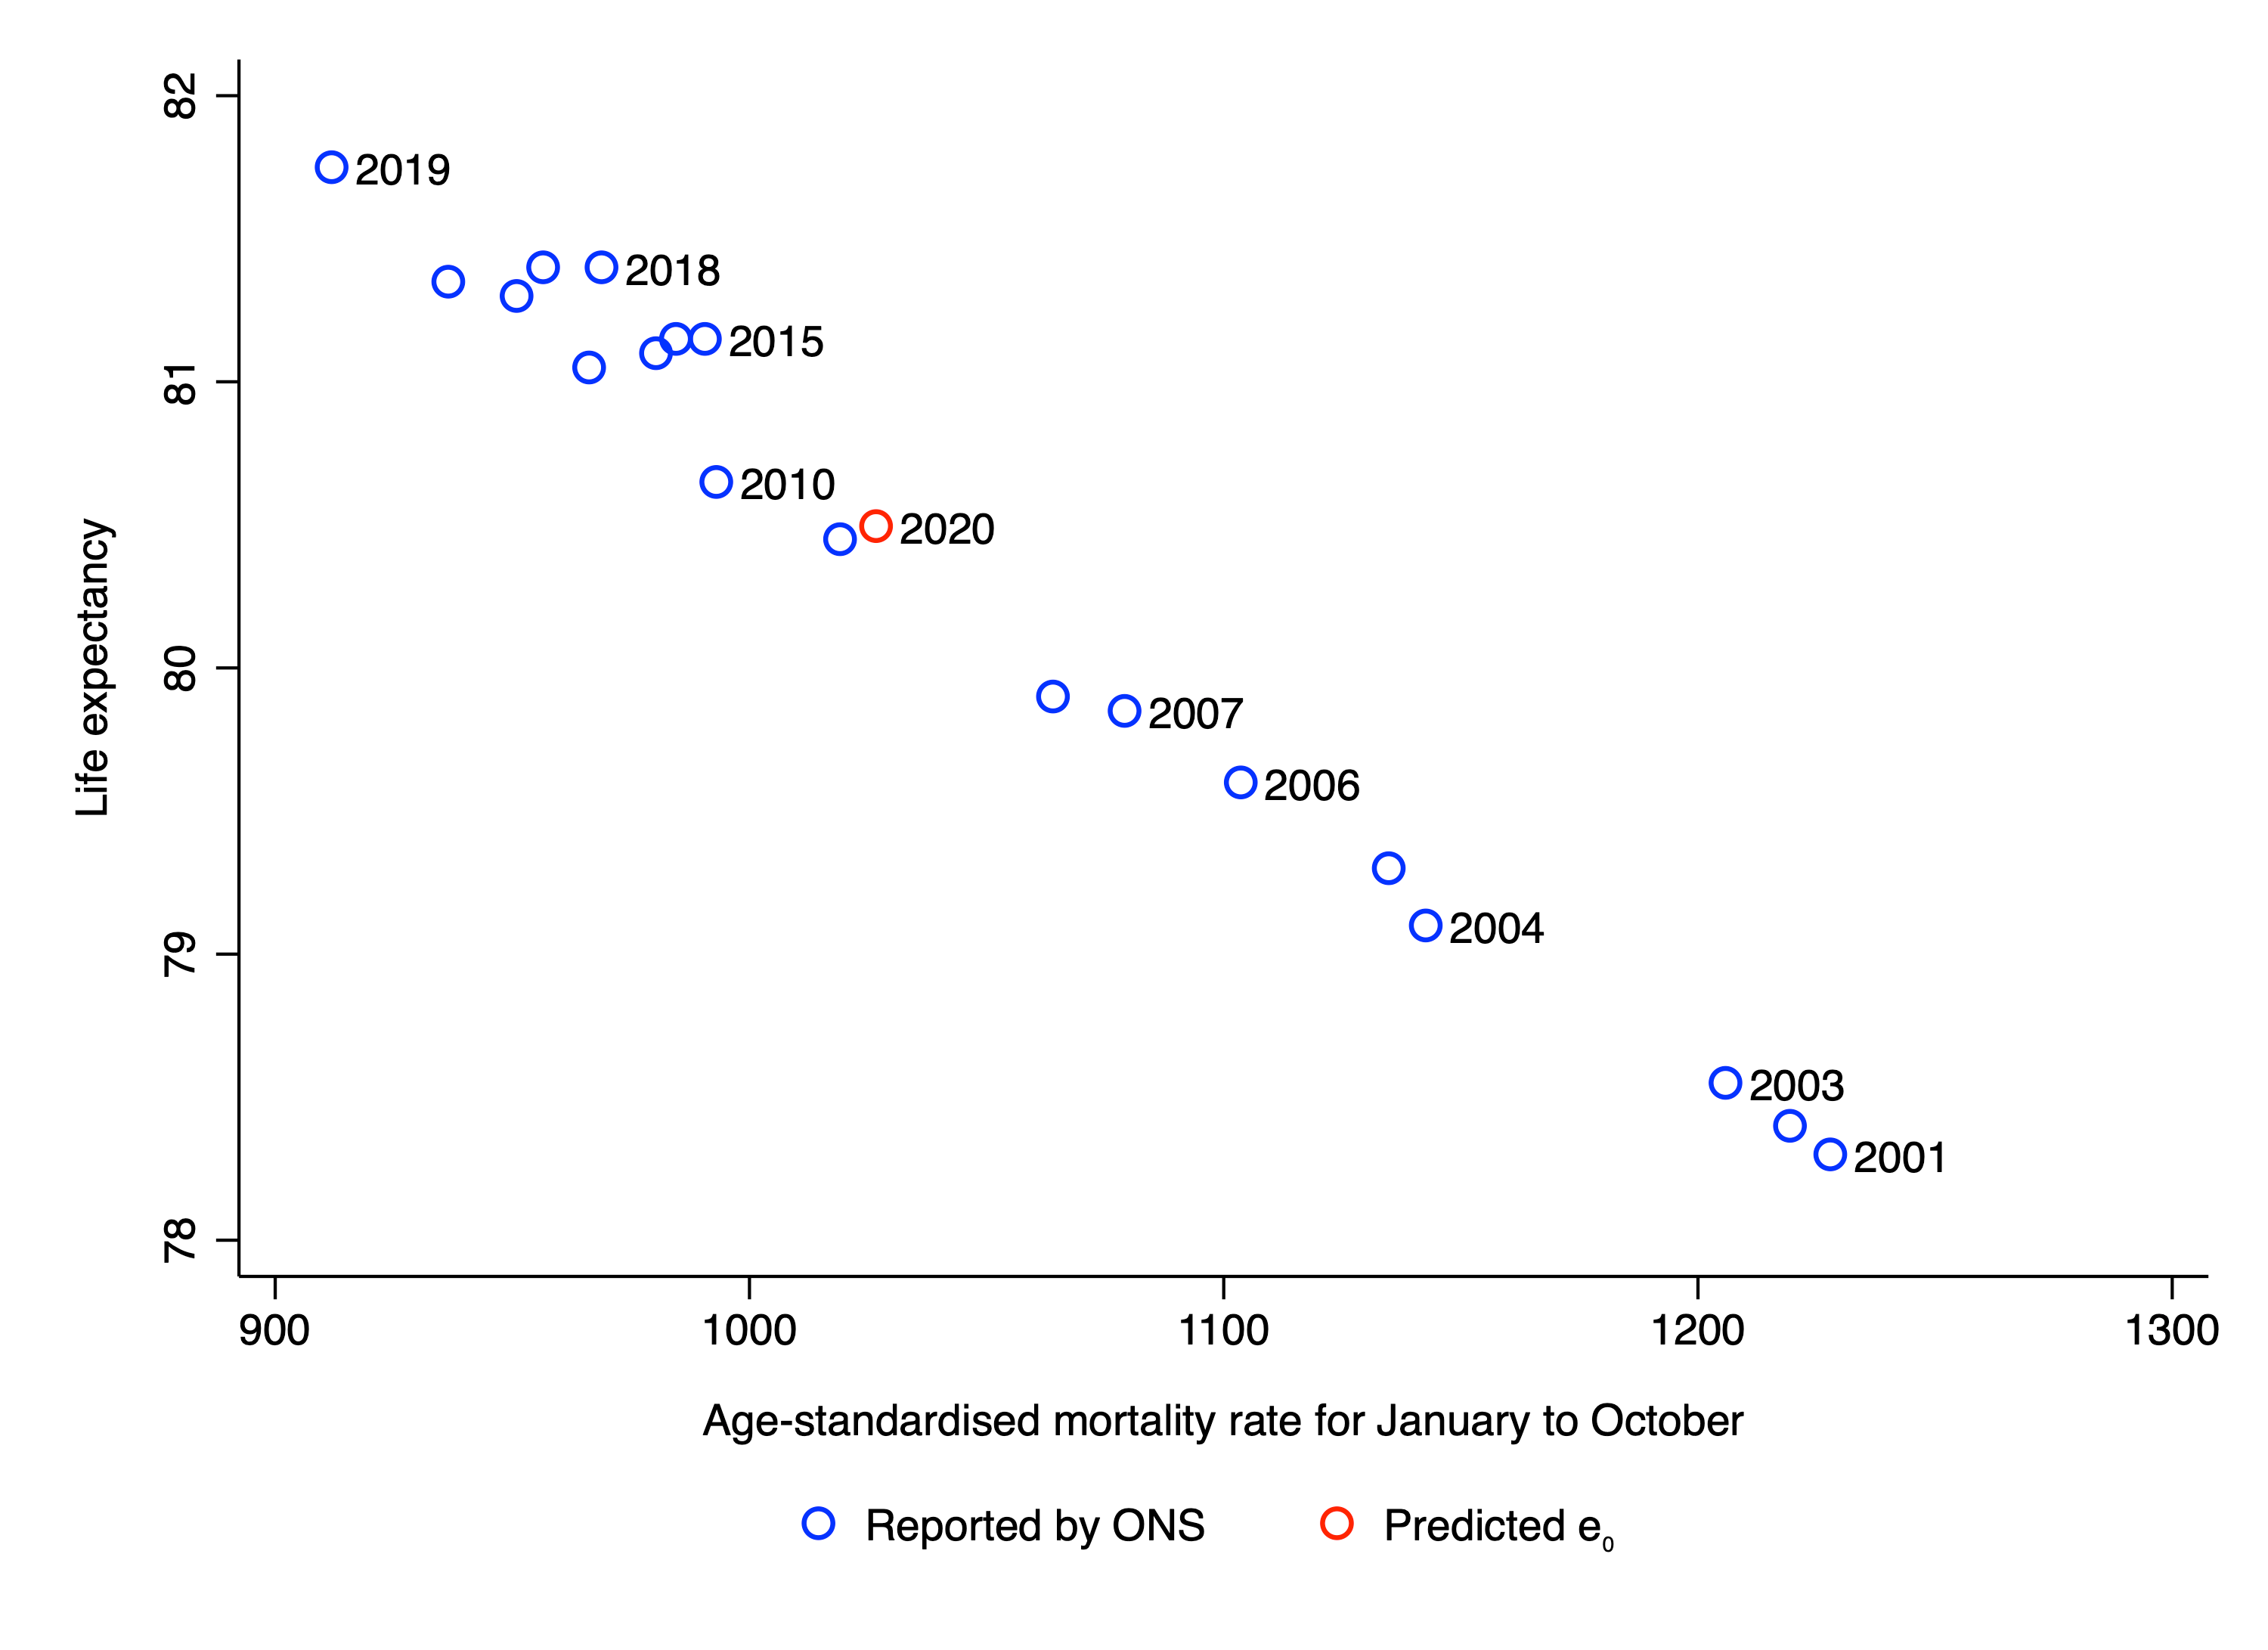
Hence one could say that the overall effect of COVID-19 has been to temporarily reduce life expectancy in England by 1.3 years. However, recall that the risk of mortality was below-trend in 2019. One might therefore want to take into account the life expectancy in 2018 as well, which was 81.4. Taking a simple average of 81.8 and 81.4 yields a figure of 81.6. Hence one could say that the overall effect of COVID-19 has been to temporarily reduce life expectancy by 1.1 years. It is important to note that predicted life expectancy in England may fall further during the last two months of the year if there is additional excess mortality during that period.
One way of putting this figure into context is to say that it is by far the largest one-year drop in life expectancy during the last two decades. Another is to point that it is much smaller than the fall in life expectancy associated with the 1918 Spanish flu, which was between 7 and 14 years, depending on the country. By way of qualification, please note that none of what I have said should be taken to imply that I believe COVID-19 is “just the flu”, or that I am for or against any particularly government policy. It seems likely that the drop in life expectancy would have been larger in the absence of lockdown measures over the last ten months. However, evaluating the efficacy of those measures requires taking into account their effects on all aspects of society, not just mortality.
Image: attributed to a follower of Solimena, Emperor visiting sick people
Thanks for reading. If you found this newsletter useful, please share it with your friends. And please consider subscribing if you haven’t done so already.