More on the second wave in England
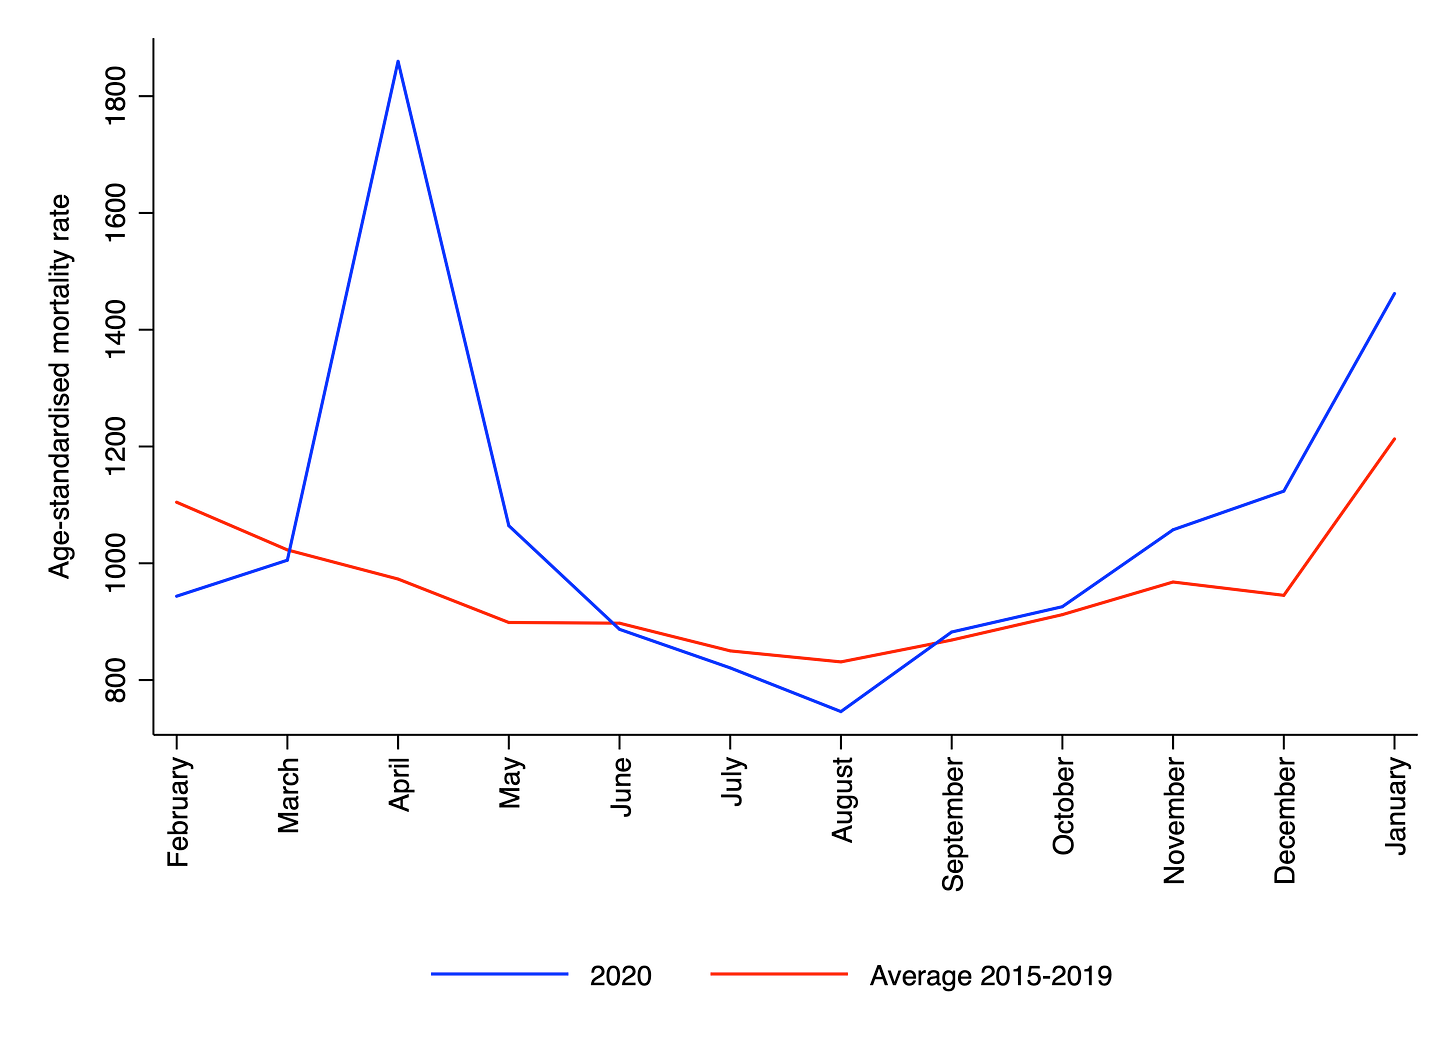
In my last newsletter, I noted that the second wave of COVID-19 in England appears less severe than the first when using the age-standardised mortality rate, but appears much more severe when using ‘deaths within 28 days of a positive test’. Another way of comparing the first and second waves (as I’ve noted previously) is to plot the age-standardised mortality rate alongside the average age-standardised mortality rate over the last five years. This comparison is shown in the chart below.
Here the second wave appears much less severe than the first. Indeed, one reason why the age-standardised mortality rate increased from October 2020 to January 2021 is that it does so every year – more people die in winter than in summer. Of course, there is still a sizeable gap between the blue and red lines in December and January, which captures the impact of COVID-19.
In April of 2020, mortality was 91% higher than expected, whereas in January of 2021, it was only 21% higher than expected. Cumulative excess mortality from March to May was 108%. Cumulative excess mortality from October to January was only 50%. Hence, although the total number of deaths in the second wave may end up being higher, total excess mortality will probably end up being lower.
Image: Canaletto, Alnwick Castle, 18th century
Lockdown scepticism
I wrote a piece for Quillette about whether lockdown scepticism is a fringe viewpoint. Here’s an excerpt:
… when assessing novel public-policy instruments, the burden of proof generally lies with those who seek to impose them. Lockdown advocates, such as Conservative MP Neil O’Brien, have made much of the fact that prominent lockdown sceptics at various points underestimated the infection fatality rate and overestimated the level of population immunity. And of course, it is absolutely right that such errors should be pointed out and corrected. But lockdown advocates have made errors, too. And since they’ve had more influence on government policy, all else being equal, their errors will have been more consequential.
More on Gregory Clark
The economic historian Gregory Clark was recently no-platformed at the University of Glasgow after students and academics preemptively denounced his proposed seminar: ‘For Whom the Bell Curve Tolls: A Lineage of 400,000 English Individuals 1750-2020 shows Genetics Determines most Social Outcomes’. Fortunately for those of us who are still interested in reading academic work (rather than simply condemning it), Clark has now uploaded the paper to his website. He added the following statement:
My talk … to the Glasgow University Applied Economics Seminar, scheduled for Feb 17, has been indefinitely "postponed" by order of the Dean of the Business School, Professor John Finch. The reference to the "bell curve" in the title was an unpardonable provocation to many of the Glasgow Faculty … you can judge for yourselves if the material so offended honest enquiry as to be denied a platform.
In the paper, Clark analyses a massive historical dataset, which he and his collaborator Neil Cummins have meticulously assembled over several years. (I actually saw Clark give an early version of the talk a few years ago in Oxford.) Clark and Cummins' dataset contains data on education, occupation, wealth and lifespan for thousands of English people who were alive between 1750 and 2020. Crucially, it also includes those people’s family connections, meaning that Clark and Cummins can see who is related to whom up to at least 3rd cousins.
How do we explain why people in the same family tend to be similar with respect to important life outcomes? As Clark notes, models based on purely genetic or purely social causation make slightly different predictions concerning the strength of the correlations between different pairs of relatives. (For example, a simple genetic model predicts that fathers and sons should be about as correlated as brothers, since you’re as related to your brother as you are to your father. Most social models, however, predict that brothers should be more correlated than fathers and sons, since brothers also share the same upbringing, same parents etc.)
Clark tests various of these predictions, and finds that a simple genetic model fits the data remarkably well. One exception is wealth, where he does find evidence of social causation. For example, he observes that paternal grandfather’s wealth is more strongly correlated with an individual’s own wealth than is maternal grandfather’s wealth. This makes sense, given that wealth was typically inherited down the male line in England. Clark’s overall conclusion is as follows:
We have to be resigned to living in a world where social outcomes are substantially determined at birth. Personally I would argue that this should push us towards compressing differences in income and wealth that are the product of such inherited characteristics. The Nordic model of the good society looks a lot more attractive than the Texan one.
In other words, his findings lead him to Nordic social democracy, rather than laissez-faire capitalism. I suspect this is not what his critics had envisaged when they denounced the talk. (In the current year, you must not only have the “right” political views, but you must get there through the “right” reasoning.) Incidentally, the word ‘eugenics’ appears nowhere in the main text.
Thanks for reading. If you found this newsletter useful, please share it with your friends. And please consider subscribing if you haven’t done so already.


