NOTE: I now write for Aporia Magazine. Please sign up there!
National IQs – estimates of the average IQ in different countries – were first compiled by Richard Lynn and Tatu Vanhanen for their 2002 book IQ and the Wealth of Nations. They have since been updated a number of times, most recently for the 2019 book The Intelligence of Nations by Richard Lynn and David Becker. (The latest version of the dataset, uploaded online after that book’s publication, is available here.)
National IQs have come under substantial criticism. In a recent article, one critic went so far as to say, “No future research should use this dataset, and published papers which have used the dataset should be corrected or retracted.” As I see it, there are four main criticisms: two valid (though not disqualifying) and two invalid. In the remainder of this article, I will review these criticisms, and explain why they do not merit the drastic action called for above.
The first major criticism of national IQs is that the inclusion and exclusion criteria used for compiling samples are not sufficiently clear. This criticism was first made by the psychometrician Jelte Wicherts and his colleagues, and has since been repeated by other critics. I believe this criticism has some validity, though I do not believe it is disqualifying.
For the latest version of the dataset, considerable effort has been made to ensure the data compilation process is transparent. The datafile indicates precisely which samples were collected, and lists their various characteristics. It also explains exactly which corrections were made for things like the FLynn effect. In addition, David Becker has written lengthy posts on the website, explaining how the latest version differs from the previous versions.
Having said that, the researchers could probably do even more to assure critics the data were compiled in a systematic way, and I hope they will for the next version of the dataset. Of course, the fact that national IQs are very strongly correlated with other measures of average cognitive ability – such as GMAT scores, scores from student assessment studies, scores from e-sports competitions, and measures of age-heaping – indicates they have a good validity.
The second major criticism of national IQs is that some of the estimates are based on small, unrepresentative samples. Again, this criticism was first made by Jelte Wicherts and his colleagues. And like the first criticism, I believe it has some validity. But I don’t believe it is disqualifying – at least for most purposes.
Let’s say your aim is to gauge the average IQ in a certain country with a high degree of accuracy. If you went to the national IQ dataset, and found the estimate for that country was based on a small, unrepresentative sample, then you would almost certainly draw wrong conclusions.
However, this is not what most people use the dataset for. Rather, they are interested in studying the relationships between average IQ and other variables. And for this purpose, it is not so important that every estimate be exactly right. Of course, it is always better to have estimates based on large, representative samples. But just because some of the estimates are probably wrong, does not mean the entire dataset is useless.
A stronger version of this criticism is that, due to its reliance on small, unrepresentative samples, the dataset is actually biased against certain countries. Indeed, several critics have alleged the estimates for Sub-Saharan African countries are systematically too low. I believe there may be validity to this criticism: some of the estimates for Sub-Saharan Africa may be slightly too low. However, as I will explain in greater detail below, I don’t believe they are substantially too low.
And in any case, if some of the estimates are based on unsatisfactory data, there are ways of dealing with this in your analysis. For example: you can re-run models without the problematic data-points; you can re-run models using alternative measures of average cognitive ability; you can Winsorize the data at a certain value (such as an IQ of 75). If your results are consistent across alternative specifications, then your conclusions probably don’t depend on the problematic data-points.
It’s also worth noting that plenty of cross-cultural research relies on unrepresentative samples (e.g., students, or employees at a particular firm). And few people say such research doesn’t merit publication. Claiming that national IQs shouldn’t be used because some of the estimates are based on small, unrepresentative samples is an example of what Scott Alexander calls “isolated demands for rigour”.
The third major criticism of national IQs is that they are flawed because the differences between certain countries or regions are simply too large. Referring to the comparison between Europe and Africa, one critic wrote, “This is a huge mean difference (∼1.6 standard deviations)”, so there is “no doubt that these estimates of national IQ for African nations are incorrect”. In other words: it’s not possible for Africa to score 1.6 standard deviations below Europe, so the estimates for Africa must be wrong.
I don’t believe this criticism has validity, as there is no scientific reason why the scores for two countries or regions cannot differ by 1.6 standard deviations or even more. As evidence for this claim, let’s compare national IQs to another measure of average cognitive ability, namely the World Bank’s harmonized test scores. These derive from the work of economist Noam Angrist and his colleagues, and have been written up in the journal Nature.
The latest version of the national IQ dataset includes a measure dubbed “QNW”, which is based on the average IQ from individual samples weighted by both sample size and data quality. By contrast, harmonized test scores are based on scores from student assessment studies (PISA, TIMSS and PIRLS). I used the 2020 figures.
As it happens, the method you use for combining information from student assessment studies can make quite a big difference to the eventual estimates you come up with. For example, some methods yield average IQ estimates lower than 60. Explaining why is beyond the scope of this article (see here and here for discussions of this issue). But suffice it to say that the method used to calculate harmonized test scores may yield estimates for certain countries that are systematically too high.
Harmonized test scores have an individual-level mean of 500 and standard deviation of 100, whereas for national IQs the corresponding figures are of course 100 and 15. So how big are the cross-country differences in harmonized test scores? In 2020, the highest scoring country (Singapore) had an average of 575, while the lowest scoring country (Niger) had an average of 304. This equates to a difference of 2.7 standard deviations – the equivalent of 41 IQ points. So it is possible for countries to differ in average cognitive ability by a very large amount.
By way of further illustration, the economist Justin Sandefur undertook a detailed study of African mathematics scores, in which he compared three methods for combining the relevant information. He concluded that scores are “low in absolute terms, with average pupils scoring below the fifth percentile for most developed economies”. In other words, 95% of students in developed countries score higher than the average African student.
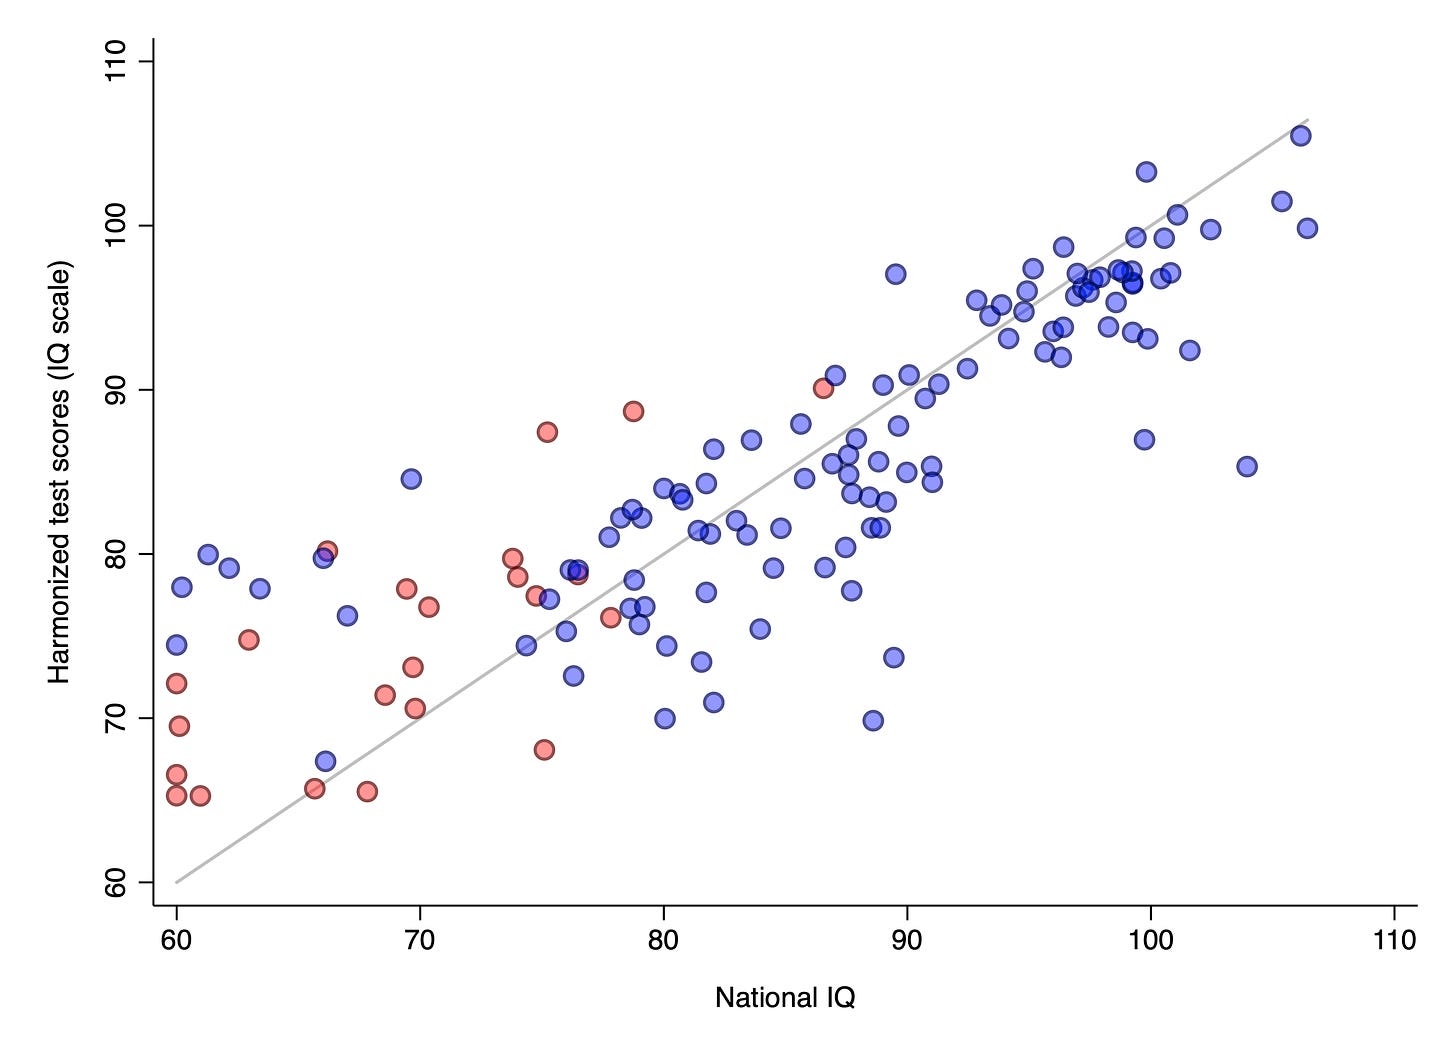
To make harominzed test scores and national IQs more comparable, I transformed harmonized test scores onto the same scale as national IQ by dividing each estimate by 100, multiplying by 15, and then adding 19.6 to make the sample means equal. The relationship between the two resulting variables is shown in the chart below, with Sub-Saharan African countries highlighted in red. The grey line is y = x.
Overall, there is a very strong relationship (r = .78), with the Sub-Saharan countries scoring low on both measures. (Note: 35 out of 169 countries have an average IQ of less than 75 on harmonized test scores.) However, what’s also true is that Sub-Saharan countries score slightly higher on harmonized test scores than they do on national IQ: most of the red dots are above the grey line.
These results suggest two things. First, even when average cognitive ability or “human capital” is measured by economists at the World Bank, Sub-Saharan countries score in the 70s or high 60s (often more than 2 standard deviations below developed countries). Second, national IQs may slightly underestimate the average cognitive ability in Sub-Saharan countries.
As noted above, whether national IQs do underestimate the average cognitive ability in Sub-Saharan countries partly depends on which method for combining information from student assessment studies is correct. This is a matter for debate among statisticians. However, there is one crude way of checking: see whether Sub-Saharan countries have higher harmonized test scores than you’d expect based on the relationship between harmonized test scores and development among non-Sub-Saharan countries.
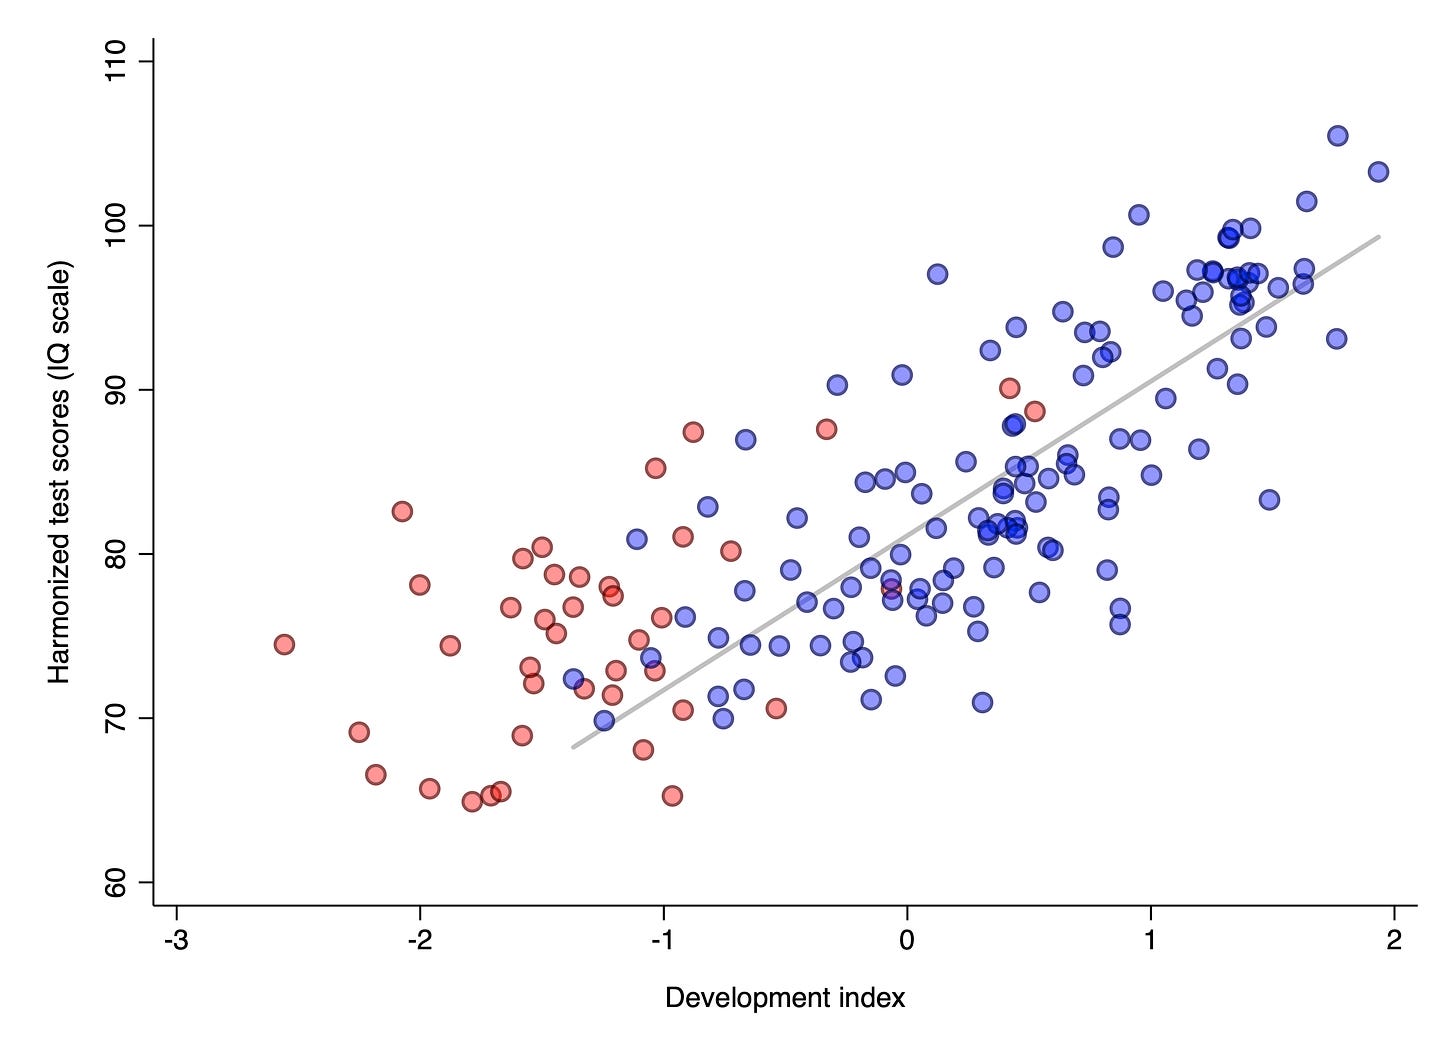
To do this, I created a simple “development index” by standardising and then averaging log GDP per capita and life expectancy. I then plotted the linear relationship between harmonized test scores and this development index for all the non-Sub-Saharan countries. This is shown as the grey line in the chart below, with Sub-Saharan countries highlighted in red:
As you can see, nearly all the Sub-Saharan countries are above the grey line, indicating they have higher harmonized test scores than you’d expect based on the relationship between harmonized test scores and development among non-Sub-Saharan countries. This is by no means proof that their estimates are too high (and hence that the national IQ estimates are about right), but it does provide weak evidence.
If I had to guess, I’d say that harmonized test scores for Sub-Saharan countries may be slightly too high, and national IQ estimates may be slightly too low. But I’m certainly open to other possibilities. In any case, there’s no grounds for rejecting national IQs purely on the basis that some estimates are too far away from others.
After all, it shouldn’t be surprising there are very large differences in average cognitive ability between Sub-Saharan and developed countries. We know that cognitive ability is affected by the environment, and the environment is much more impoverished in Sub-Saharan Africa. Indeed, much of that region is yet to experienced a sustained FLynn effect.
Even hereditarians like Lynn don’t claim that all of the difference between Sub-Saharan Africa and Europe (or East Asia) is due to genes. In fact, Lynn has estimated (Chapter 4, Section 18) the average genotypic IQ in Sub-Saharan Africa to be 80 – about 10 points higher than the average measured IQ.
What’s more, it doesn’t make sense for environmentalists to argue the measured IQ in Sub-Saharan Africa is as high as 80. We know with some confidence that black people living in the US score about 85 on IQ tests, as compared to 100 for whites. If the measured IQ in Sub-Saharan Africa is 80, this would mean the massive difference in environment between Sub-Saharan Africa and the US reduces IQ by only 5 points, yet the comparatively small difference in environment between black and white Americans somehow reduces it by 15 points.
The fourth major criticism of national IQs is that they are flawed since they imply that a large fraction of the population in some countries must have an intellectual disability – which is highly implausible. This is because, so critics argue, previous versions of the DSM used “IQ < 70” as the criterion for mild intellectual disability. I do not believe this criticism has validity.
As the psychologist Russell Warne notes, “people can have a low IQ score for a variety of reasons that have nothing to do with their actual intelligence.” As a result, “mental health professionals do not diagnose people with an intellectual disability solely on the basis of a low IQ”. Warne argues it is therefore wrong to describe national IQs as measures of average “intelligence” (something Wicherts has also argued). And in this post, I have purposefully employed the term “cognitive ability” instead.
However, there’s a more important reason why the criticism above doesn’t work, which was first identified by Arthur Jensen (p. 367). As he notes, “What originally drew me into research on test bias was that teachers of retarded classes claimed that far more of their black pupils seem to look and act less retarded than the white pupils with comparable IQ.” (He is of course using ‘retarded’ in the technical sense.) Jensen continues, “the explanation lies in the fact that IQ per se does not identify the cause of the child’s retardation”.
I would recommend reading the relevant section of Jensen’s book in full, but I’ll do my best to summarise it here. In short, there are two types of retardation: familial and endogenous. The former comprises individual from low-IQ families that, due to the luck of the draw, happen to have particularly low IQs. The latter comprises individuals who have much lower IQs than their families due to some genetic condition or environmental trauma. These individuals typically have various behavioural problems and therefore “seem retarded”.
As Jensen notes, evidence at the time showed that most black people with retardation were of the familial type, whereas about half of white people with retardation were of the endogenous type. Studies published both before and since appear to support Jensen’s observation that familial retardation (the type not associated with behavioural problems) is more common among blacks. What this means is that most black people who score below 70 on IQ tests do not have any kind of mental disability.
There are four main criticisms of national IQs: the inclusion and exclusion criteria used for compiling samples are not sufficiently clear; some of the estimates are based on small, unrepresentative samples; they are flawed because the differences between certain countries or regions are too large; they are flawed since they imply that a large fraction of the population in some countries has an intellectual disability.
I have argued that the first and second criticisms have some validity but are not disqualifying, and that the third and fourth criticisms are simply wrong. While the national IQ dataset is by no means perfect, and there is certainly room for improvement, it should continue to be used for research. One important task for such research is to obtain better estimates for those countries where good data are currently lacking.
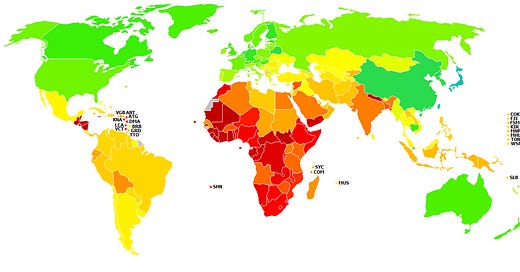
Image: David Becker, Global distribution of national IQs, 2019
Thanks for reading. If you found this newsletter useful, please share it with your friends. And please consider subscribing if you haven’t done so already.


