


Excess deaths and confirmed COVID-19 deaths in Europe


The most widely cited measure of COVID-19’s lethality is confirmed deaths per million people, as reported on sites like Our World in Data. In a previous newsletter, I noted that this measure has reasonably good validity in Europe insofar as it strongly correlates with two measures of excess mortality. However, in that analysis I merely looked at the association between excess mortality and confirmed COVID-19 deaths per million people. I did not look to see whether either measure gave systematically larger or smaller values.
In order to examine this possibility, I obtained data weekly data on the number of deaths in each European country from Eurostat. I then computed excess deaths from week 10 to week 52 of 2020 in the normal way, i.e., by taking the total for 2020 and subtracting the average over the last five years. I began in week 10 (rather than at the start of the year) since that was approximately when the pandemic in Europe began.
Note that using a five-year average for expected deaths may overestimate excess deaths since it does not take account of population ageing. In my last newsletter, I estimated that the true number of excess deaths in the UK may be 10–20% lower than the official figure (i.e., still very large).
I also obtained data on the number of confirmed COVID-19 deaths up to 31 December from Our World in Data. Due to reporting delays, data on excess deaths were only available for 20 countries. I then computed excess deaths from week 10 to week 52 as a percentage of confirmed COVID-19 deaths up to 31 December. The chart below plots this metric against confirmed COVID-19 deaths per million people over the same time period.
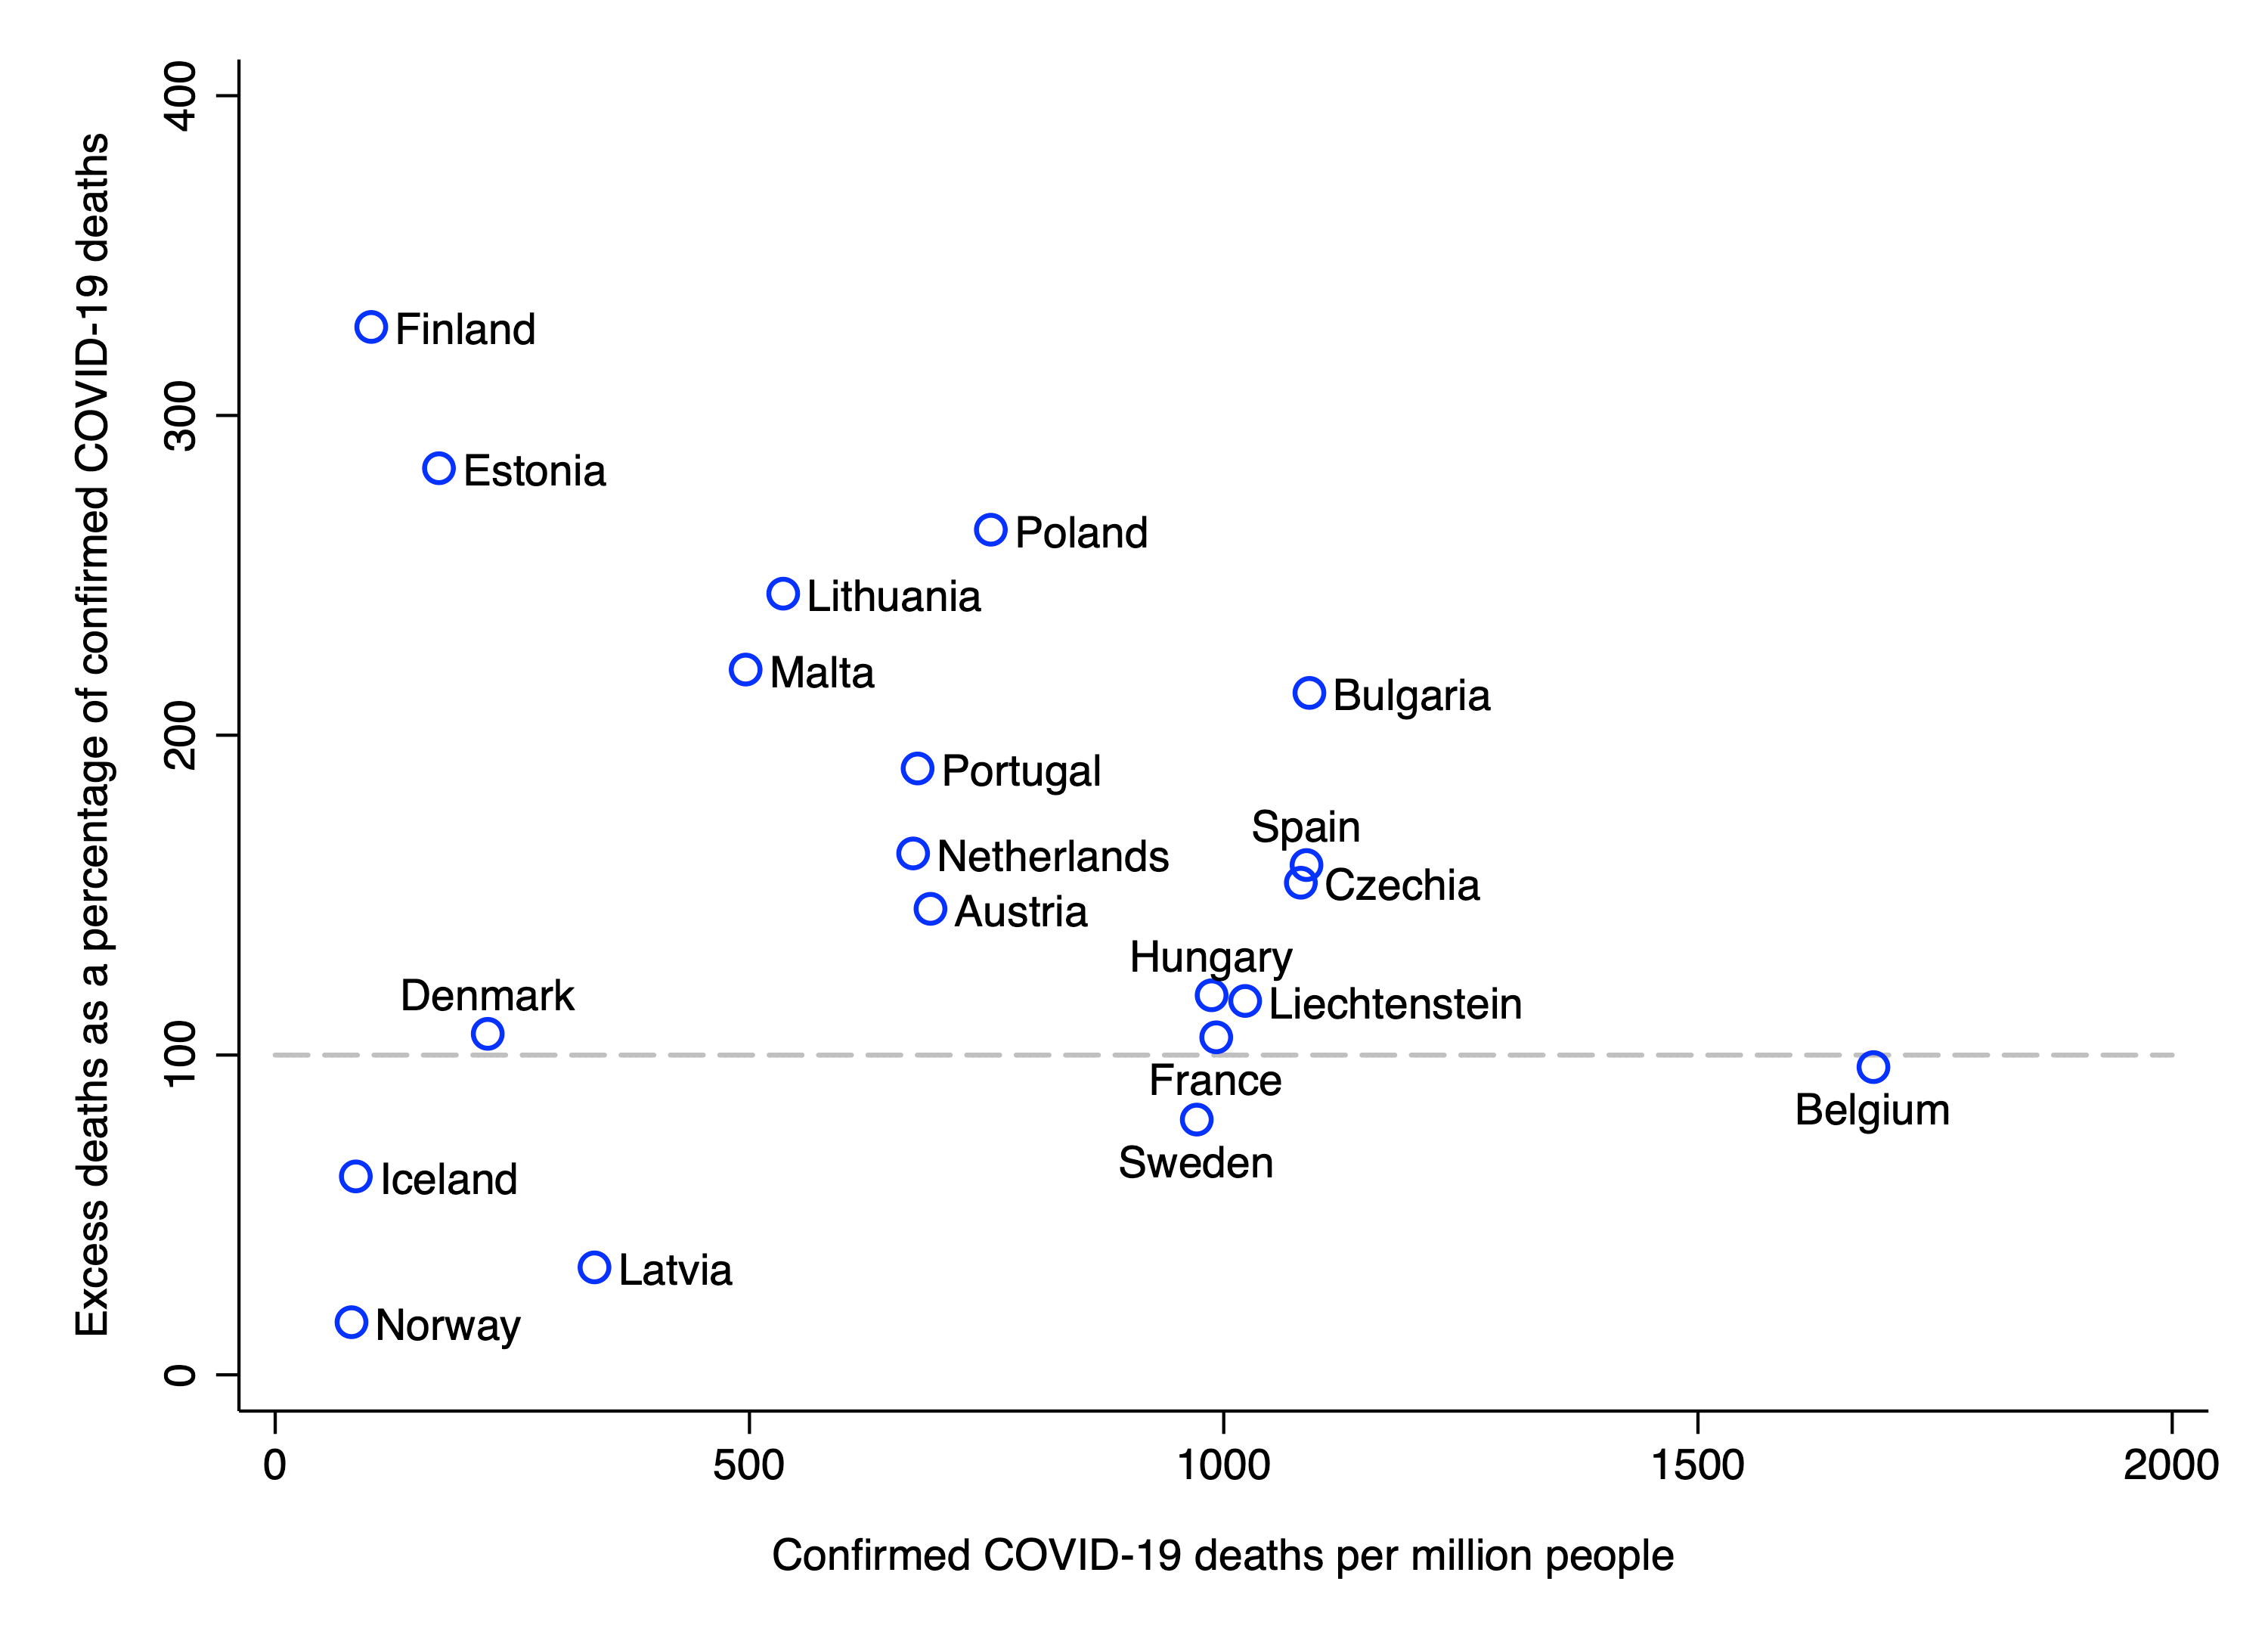
The y-axis can be seen as a rough measure of underreporting, i.e., of the extent to which confirmed deaths underestimates the true number of deaths attributable to COVID-19. (Given that excess deaths was not adjusted for changes in the population age-structure, it is probably a slight overestimate of underreporting.) Of course, part of the disparity between excess deaths and confirmed deaths in any given country could be due to additional mortality from other causes.
Overall, the extent to which excess deaths exceeds confirmed deaths is greater for countries that have reported fewer confirmed deaths per million people. In Finland, excess deaths is more than three times higher than confirmed deaths, whereas in Belgium, the two values are almost identical. Interestingly in Sweden, excess deaths is 26% less than confirmed deaths. The chart below plots excess deaths per million people against confirmed deaths per million people.
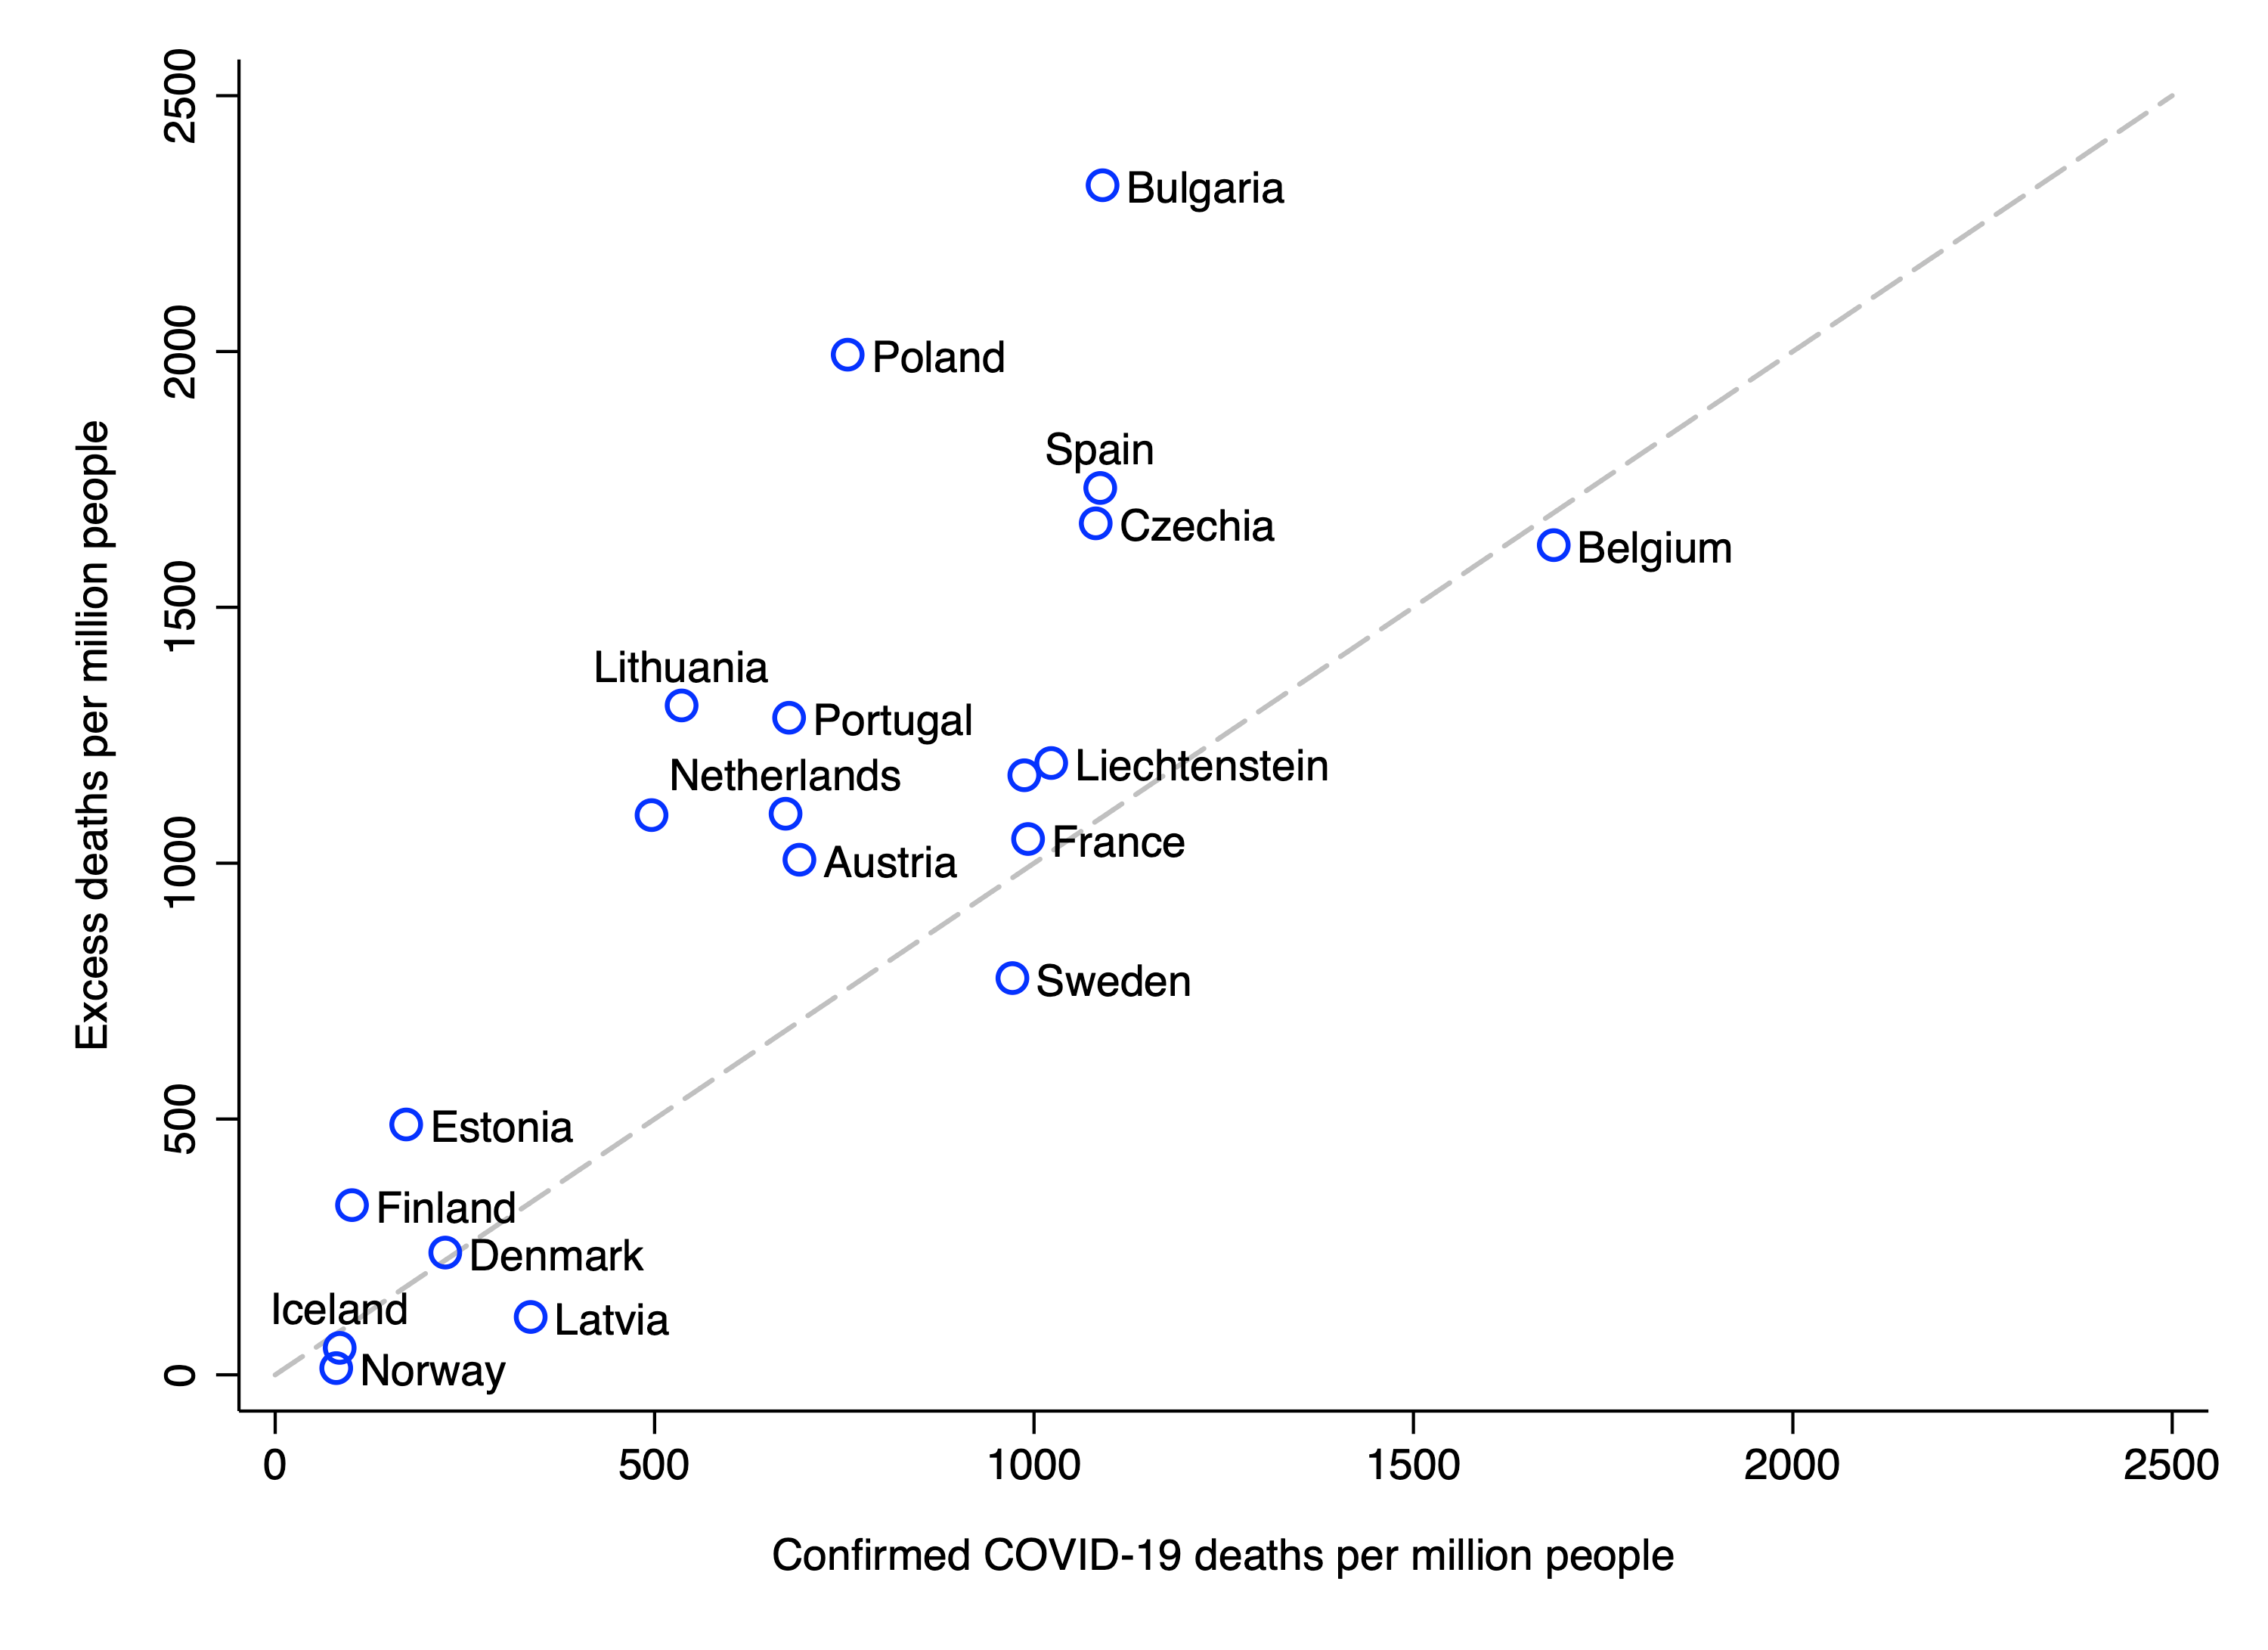
The relationship is strong and positive (r = .77, p < 0.001), showing once again that confirmed COVID-19 deaths per capita has reasonably good validity in Europe. However, certain countries go up in the rankings, while others come down. For example, Poland is ranked 9 out of 20 on confirmed deaths per million, but is ranked 2 out of 20 on excess deaths per million. By contrast, Sweden is ranked 8 out of 20 on confirmed deaths per million, but is ranked 14 out of 20 on excess deaths per million.
I should end by noting that neither of these two measures is ideal. A better metric for comparing the impact of the pandemic in different countries would be the change in life expectancy. Once data on this metric become available, it will be interesting to see where the various countries end up.
Image: Leopold Munsch, Group of Mountain Climbers Beside the Pasterze Glacier
The second wave in England and Wales
I previously noted that – since the beginning of the second wave in England and Wales – excess deaths has been running lower than two other metrics for the number of deaths attributable to COVID-19. I also noted that there was a sharp uptick in excess deaths in the first week of 2021. Where do things currently stand? The chart below plots all three metrics up to the third week of 2021 (which I have called “week 56”).
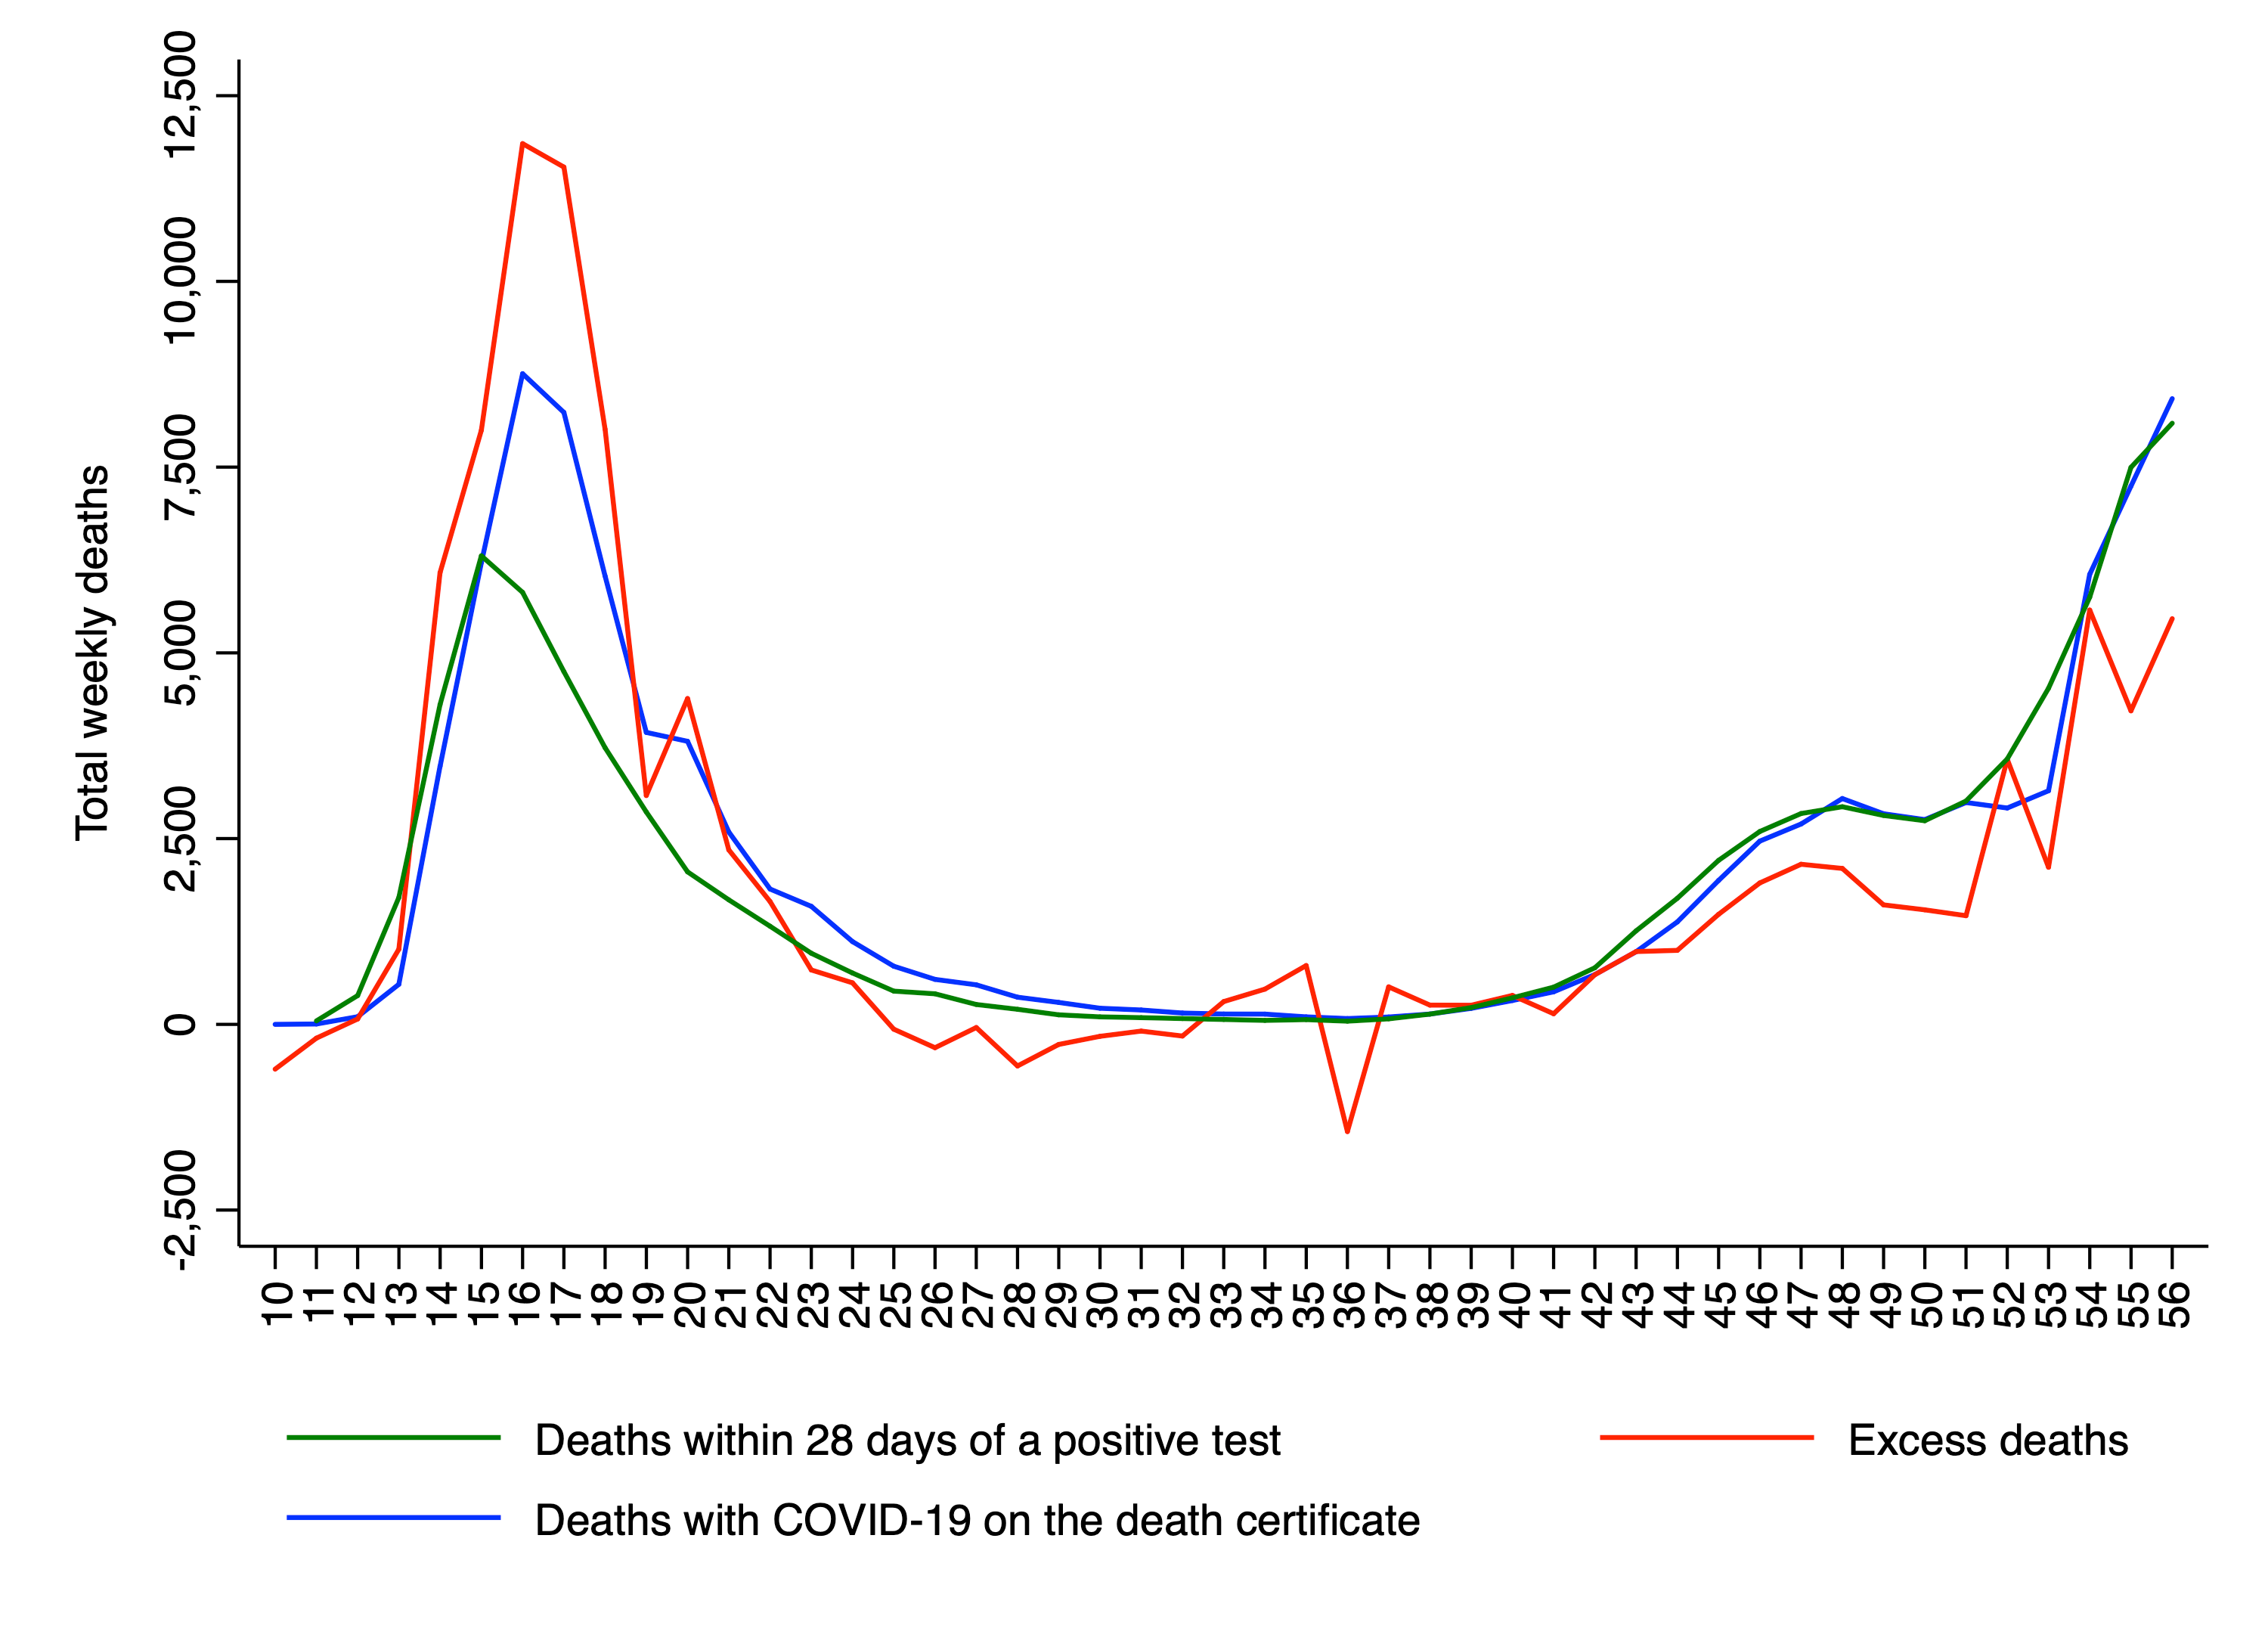
While excess deaths has remained high during “week 55” and “week 56” (the second and third weeks of 2021), it has not accelerated upward like it did in the first wave. This is in contrast to the other two metrics, which have continued to rise. Since week 40, cumulative excess deaths is 36,367. By contrast, cumulative deaths with COVID-19 on the death certificate is 50,283 (38% higher), while cumulative deaths within 28 days of a positive test is 53,140 (46% higher).
Thanks for reading. If you found this newsletter useful, please share it with your friends. And please consider subscribing if you haven’t done so already.